


Jensen Huang resigned as chief executive of Nvidia on 12 November 2026. The New York Times first reported his relationship with Alice Huang, an executive at Megaspeed whom U.S. officials had been investigating, on 29 October. He apologised to staff in a letter on 8 November, and the board accepted his resignation on 11 November after a second report. Chief financial officer Colette Kress is interim CEO.
To put the share price reaction in context, I measured 22 other listed companies whose CEO left during a scandal. Each stock is compared with its home market in four windows: the year before the first report, the first report to the exit, the exit day, and the 12 months after.
Summary:
In the 12 months after the exit, the median stock trailed its market by 15.9%. 16 of the 22 trailed. A market model, which adjusts for each stock’s sensitivity to the market, gives a median of -14.1%.
The same stocks had a median 12-month result of +2.0% relative to their market in the three years before the scandal. 17 of 22 did worse after the exit than that baseline; the median shortfall was 17.6 percentage points.
For the 12 corporate misconduct cases, most of the loss came before the CEO left: the median stock fell 19.1% relative to its market between the first report and the exit, and 11 of 12 fell. Measured from the close before the first report to 12 months after the exit, all 12 trailed, with a median of -29.6%.
In 9 of the 10 personal conduct cases, the exit was announced on the same day as the news that led to it. Their median 12-month result was -13.0%. The mean was +2.4% because of Lululemon (+85.5%) and Kohl’s (+74.0%).
Exit-day moves were small. The median was +0.1% and 4 of 22 moved more than 5% in either direction. The largest fall was HP at -8.5%.
Nvidia fell 24.4% from the 28 October close to 13 November. Over the same days the iShares Semiconductor ETF (SOXX) fell 14.2% and the S&P 500 (SPY) fell 2.3%. On the exit day Nvidia fell 4.0% relative to the S&P 500, the second-largest exit-day fall in the set after HP.
Terms
Benchmark: the home market index or index fund each stock is compared with: SPY (S&P 500) for US stocks, ISF.L (FTSE 100) for UK stocks, the DAX for Germany, the SMI for Switzerland and STW.AX (S&P/ASX 200) for Australia.
Market-adjusted return (buy-and-hold abnormal return, BHAR): the stock’s buy-and-hold return over a window minus the benchmark’s buy-and-hold return over the same days. A result of -15% means the stock returned 15 percentage points less than its market. All results are in this form unless stated.
Market model: an alternative adjustment that scales the benchmark’s daily return by the stock’s beta before subtracting it, then sums the daily differences. Beta is the sensitivity of the stock’s daily return to the benchmark’s daily return, estimated from trading days 500 to 30 before the first report. The median beta in the sample is 1.17.
First report: the first trading day on which the share price could react to the scandal becoming public.
Exit day (day 0): the first trading day on which the share price could react to the CEO’s departure being announced.
Baseline: the median of the stock’s market-adjusted 12-month returns over the three years before the first report, with a new 12-month window starting every 21 trading days. It shows what a typical year looked like for that stock before the scandal.
Median and middle half: the median is the middle case. The middle half (interquartile range) is the range between the 25th and 75th percentile cases.
The test
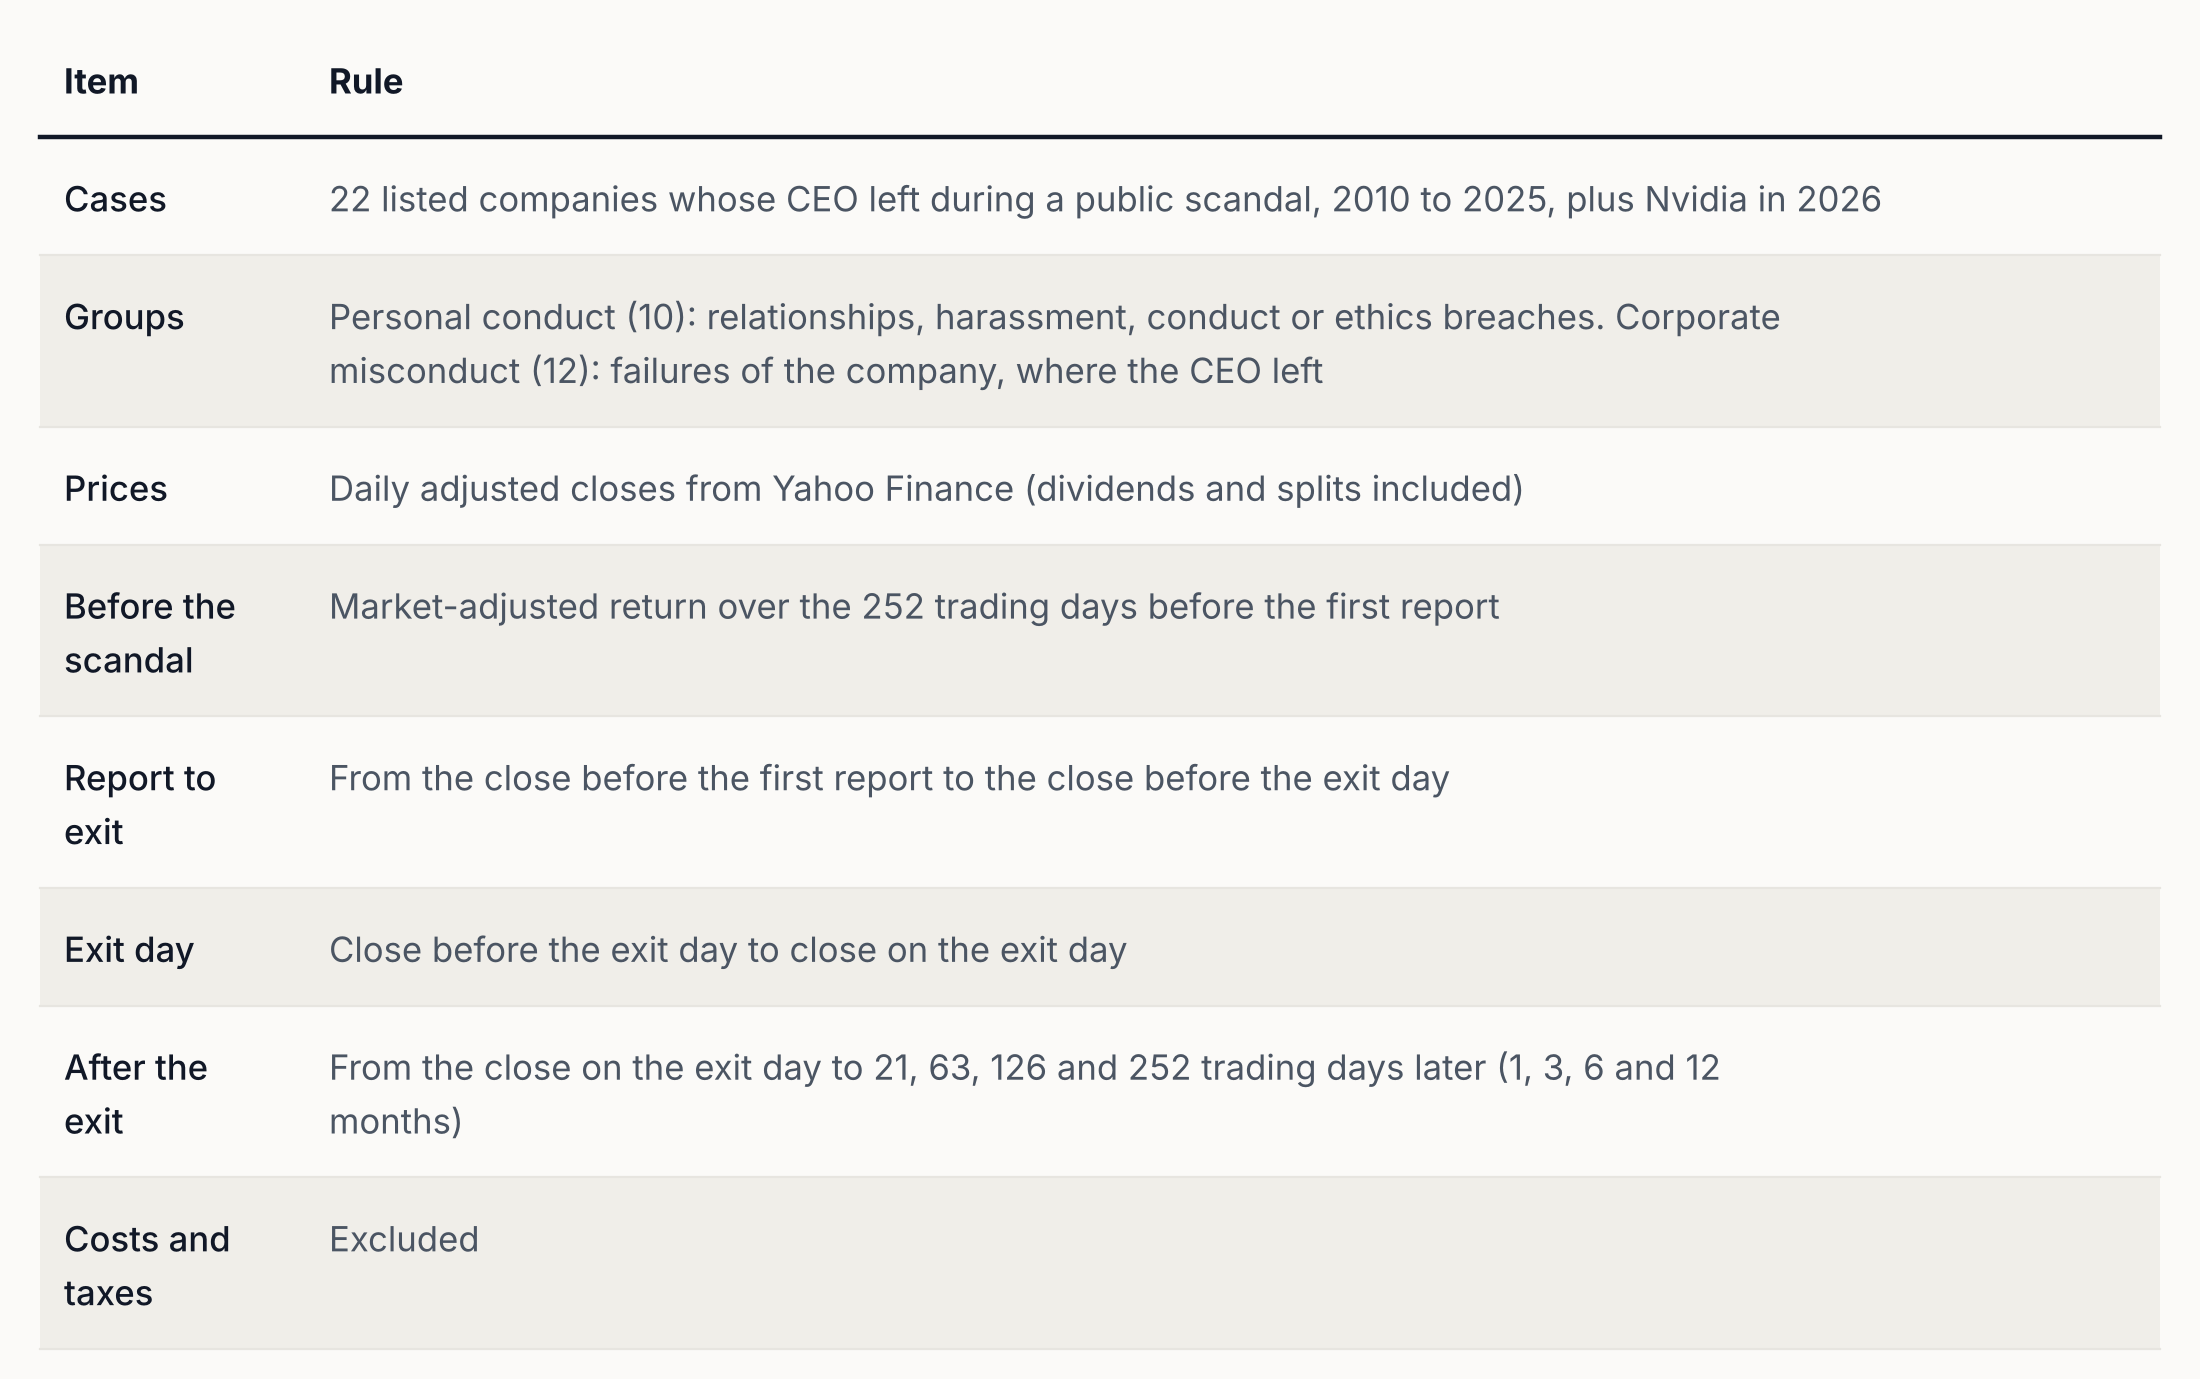
Cases were chosen from well-documented CEO exits where the scandal was the stated or reported reason for leaving and the company’s shares traded on a major exchange with daily data. CBS (Leslie Moonves, 2018) met the criteria but was dropped because Yahoo Finance no longer serves its price history.
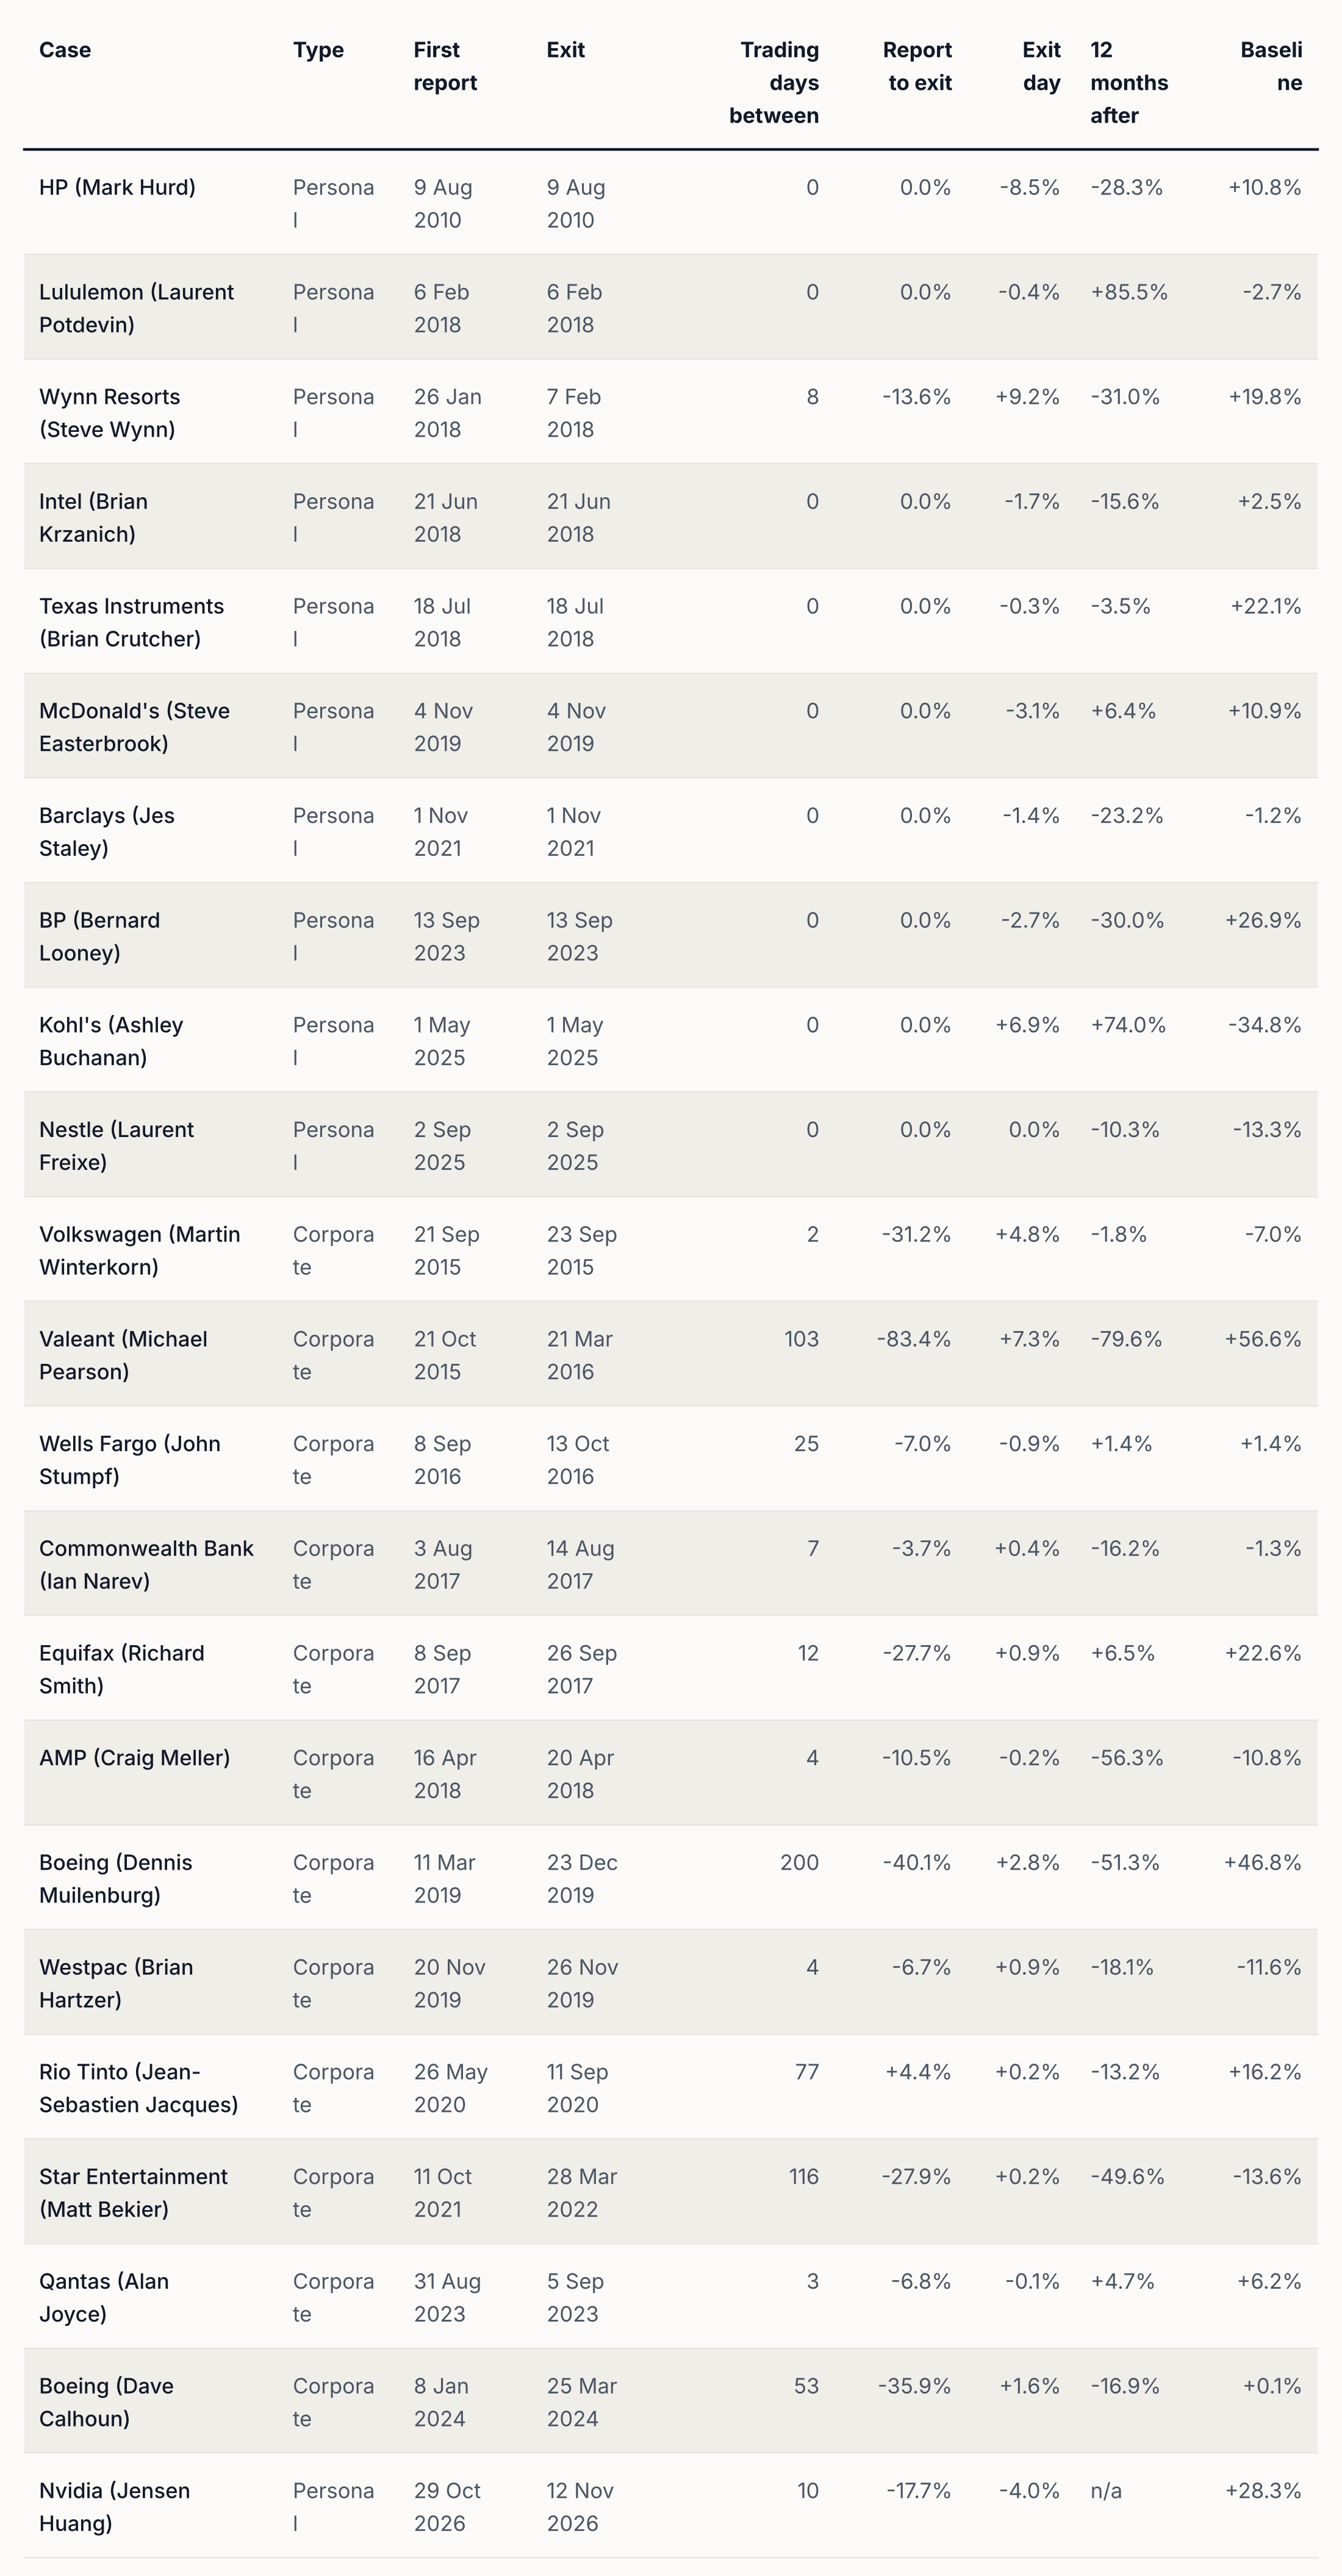
Dates are trading days. Where an announcement came after the close or on a weekend, the date is the next trading day.
Result 1: Nvidia fell further than chip stocks after the first report
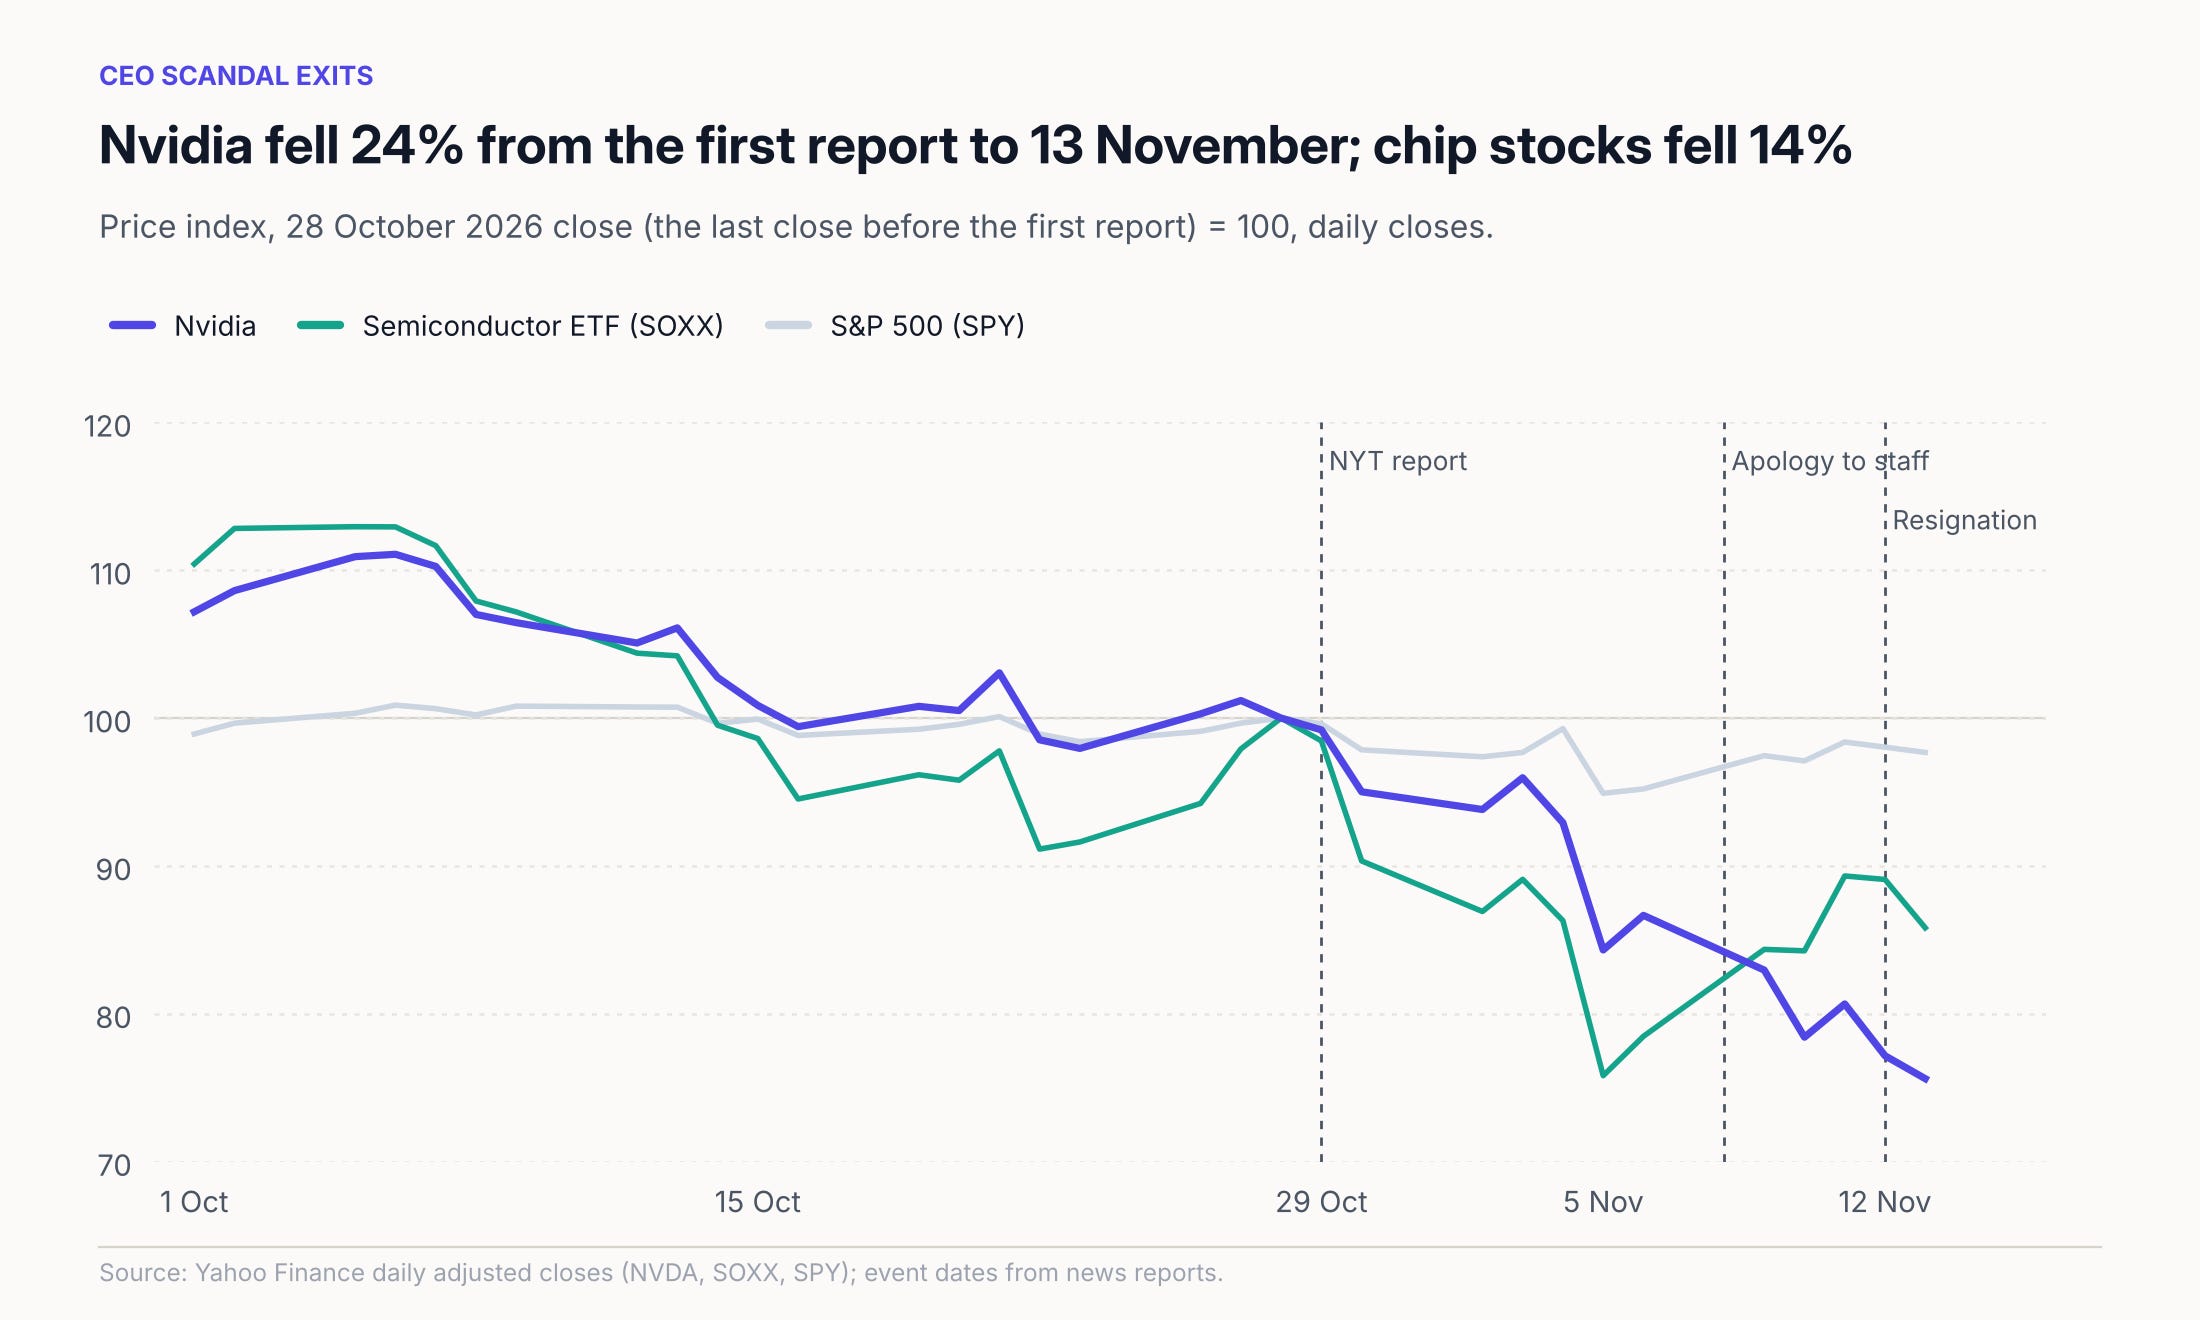
From the 28 October close, the last before the first report, to the 13 November close, Nvidia fell 24.4%. SOXX fell 14.2% and SPY fell 2.3%. Nvidia’s return was 22.1 percentage points below the S&P 500 and 10.2 percentage points below the semiconductor ETF. SOXX holds Nvidia, so the gap to chip stocks excluding Nvidia is somewhat larger.
The gap to chip stocks came on the days after the apology letter and on the exit day. On the two earlier days of large falls, Nvidia fell less than SOXX but more than the S&P 500:
30 October, the day after the report: Nvidia fell 4.2% and SOXX fell 8.2%.
5 November: Nvidia fell 9.3% and SOXX fell 12.1%. This was a sector-wide fall.
9 and 10 November, the two trading days after the apology letter: Nvidia fell 9.5% while SOXX rose 7.4%. This is the clearest move specific to Nvidia.
12 November, the exit day: Nvidia fell 4.3%, SOXX fell 0.3% and SPY fell 0.4%.
In the 12 months before the first report, Nvidia’s return was close to the market’s: +12.7% against +13.9% for SPY, a difference of -1.2%. Its baseline, the typical 12-month result in the three years before, was +28.3%.
Result 2: the median path declined after the exit
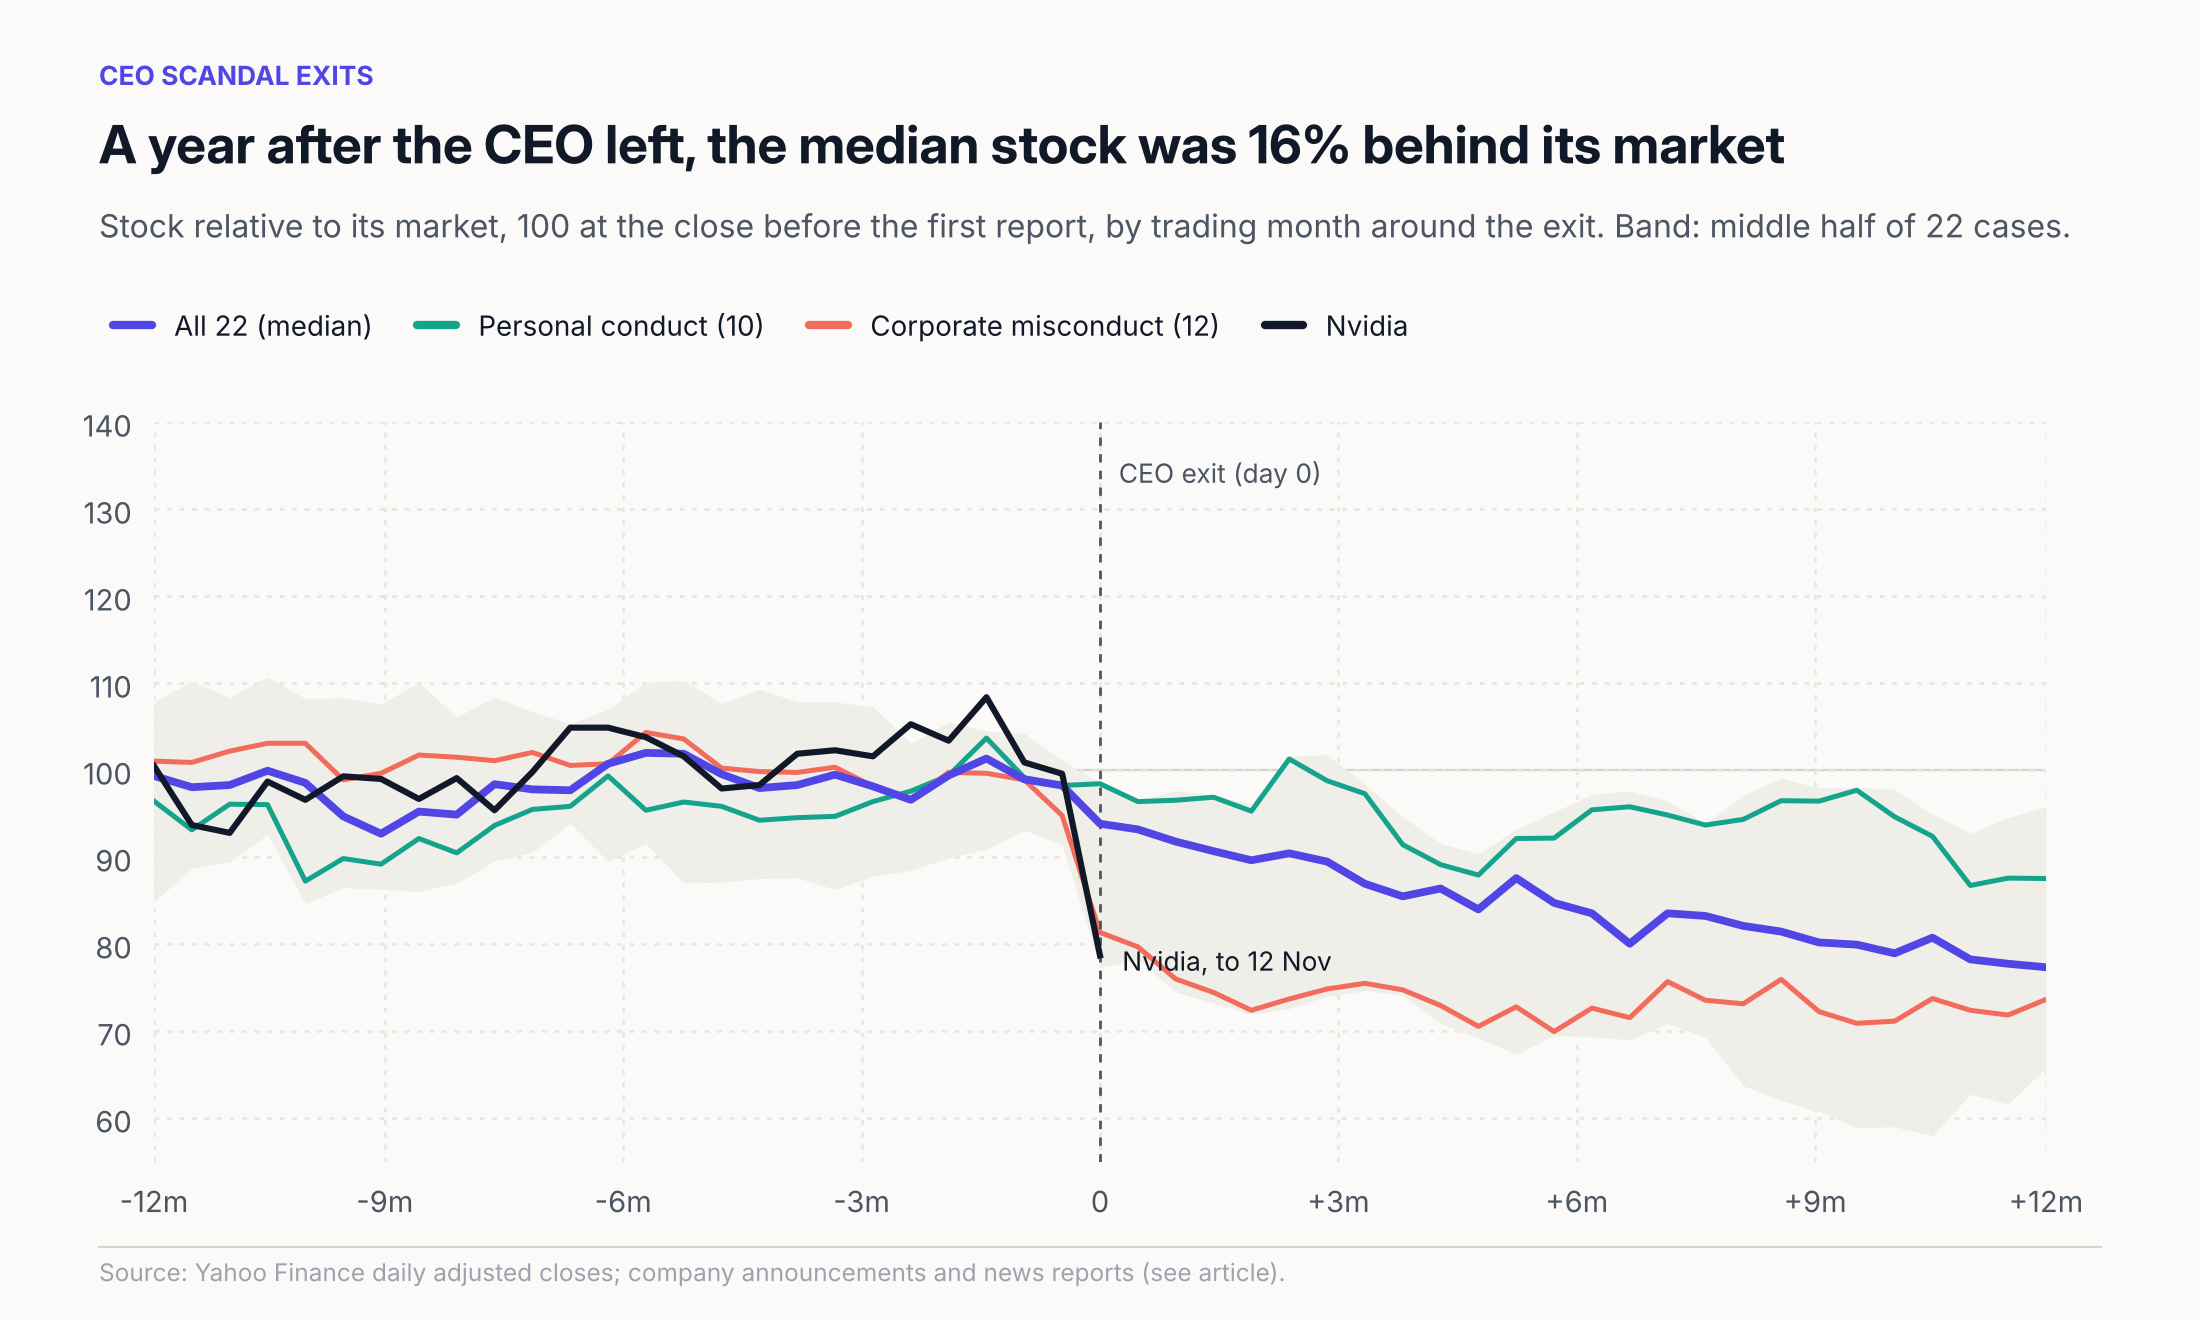
The chart sets each stock’s price relative to its benchmark to 100 at the close before the first report. The median of the 22 cases was 93.8 on the exit day and 77.3 about 12 months later (250 trading days). The corporate misconduct median was already 81.3 on the exit day. The personal conduct median was 98.5 on the exit day, because most of those exits were announced together with the news that led to them, and 87.6 about 12 months later. Nvidia’s line ends at 78.7 on the exit day.
Result 3: corporate scandals did most of their damage before the CEO left
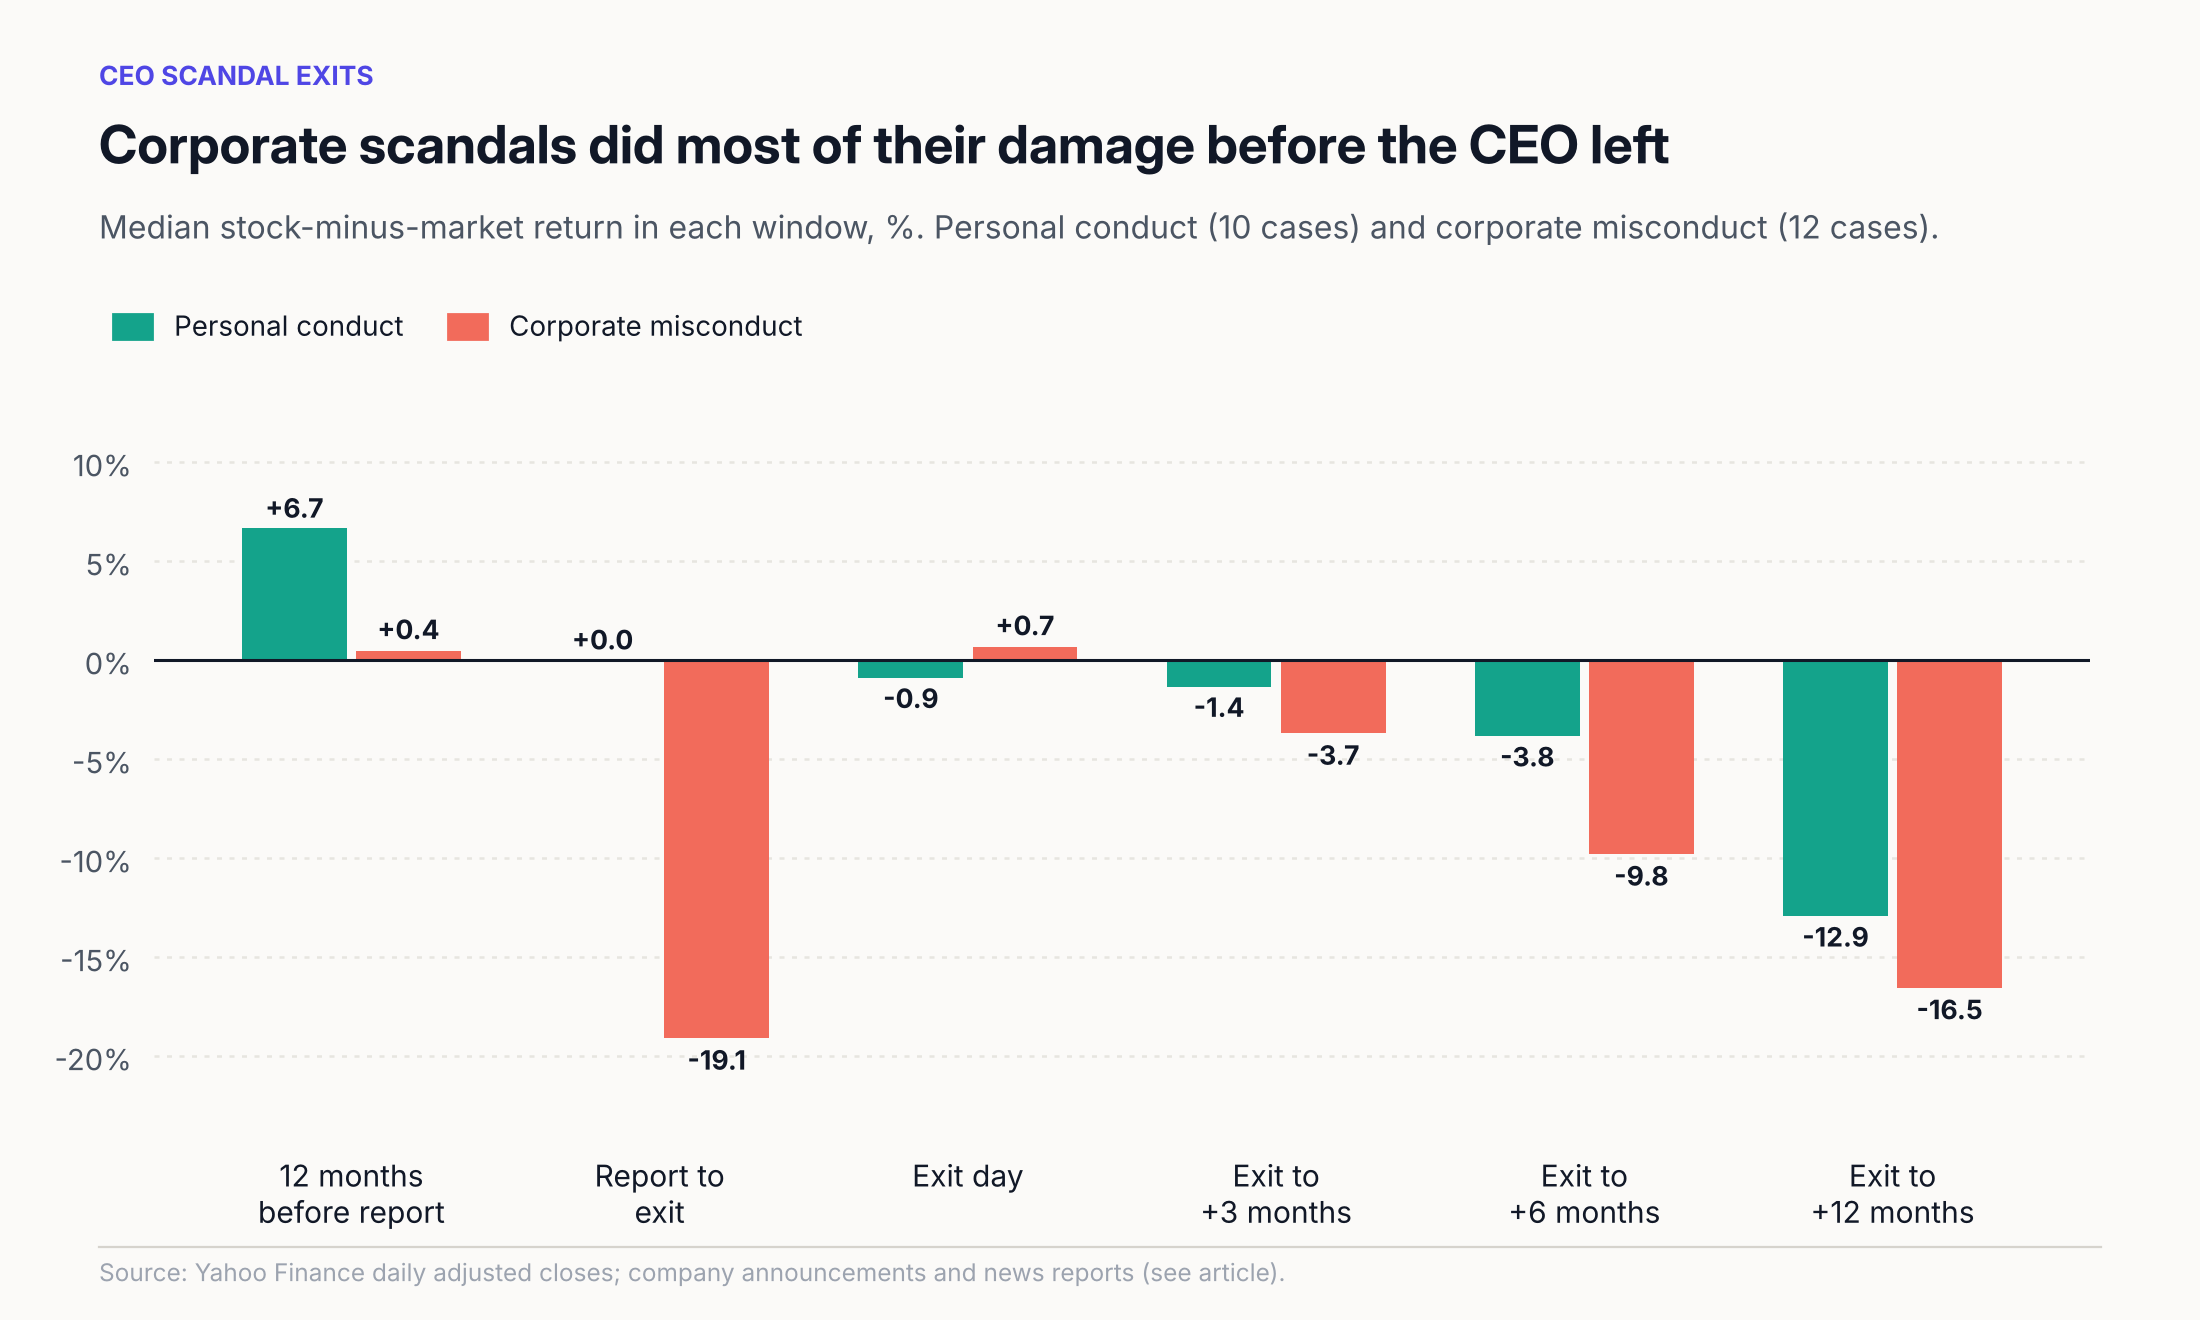
Before the scandal: no consistent pattern. The median result over the 12 months before the first report was +0.9%. Five stocks had beaten their market by more than 20% and four had trailed by more than 10%.
Report to exit: in the 13 cases with a gap between the first report and the exit, the median fall relative to the market was 13.6%, and 12 of 13 fell. For corporate cases alone the median was -19.1%.
After the exit: the median was -3.0% at 3 months, -7.7% at 6 months and -15.9% at 12 months. Corporate cases: -3.7%, -9.8% and -16.5%. Personal cases: -1.4%, -3.9% and -13.0%.
In the 13 gap cases, a larger fall before the exit went with a weaker 12 months after it, with a correlation of 0.60. The link depends on Valeant: without it the correlation is 0.24, and the rank correlation for all 13 is 0.43.
Result 4: most stocks did worse after the exit than in their own recent history
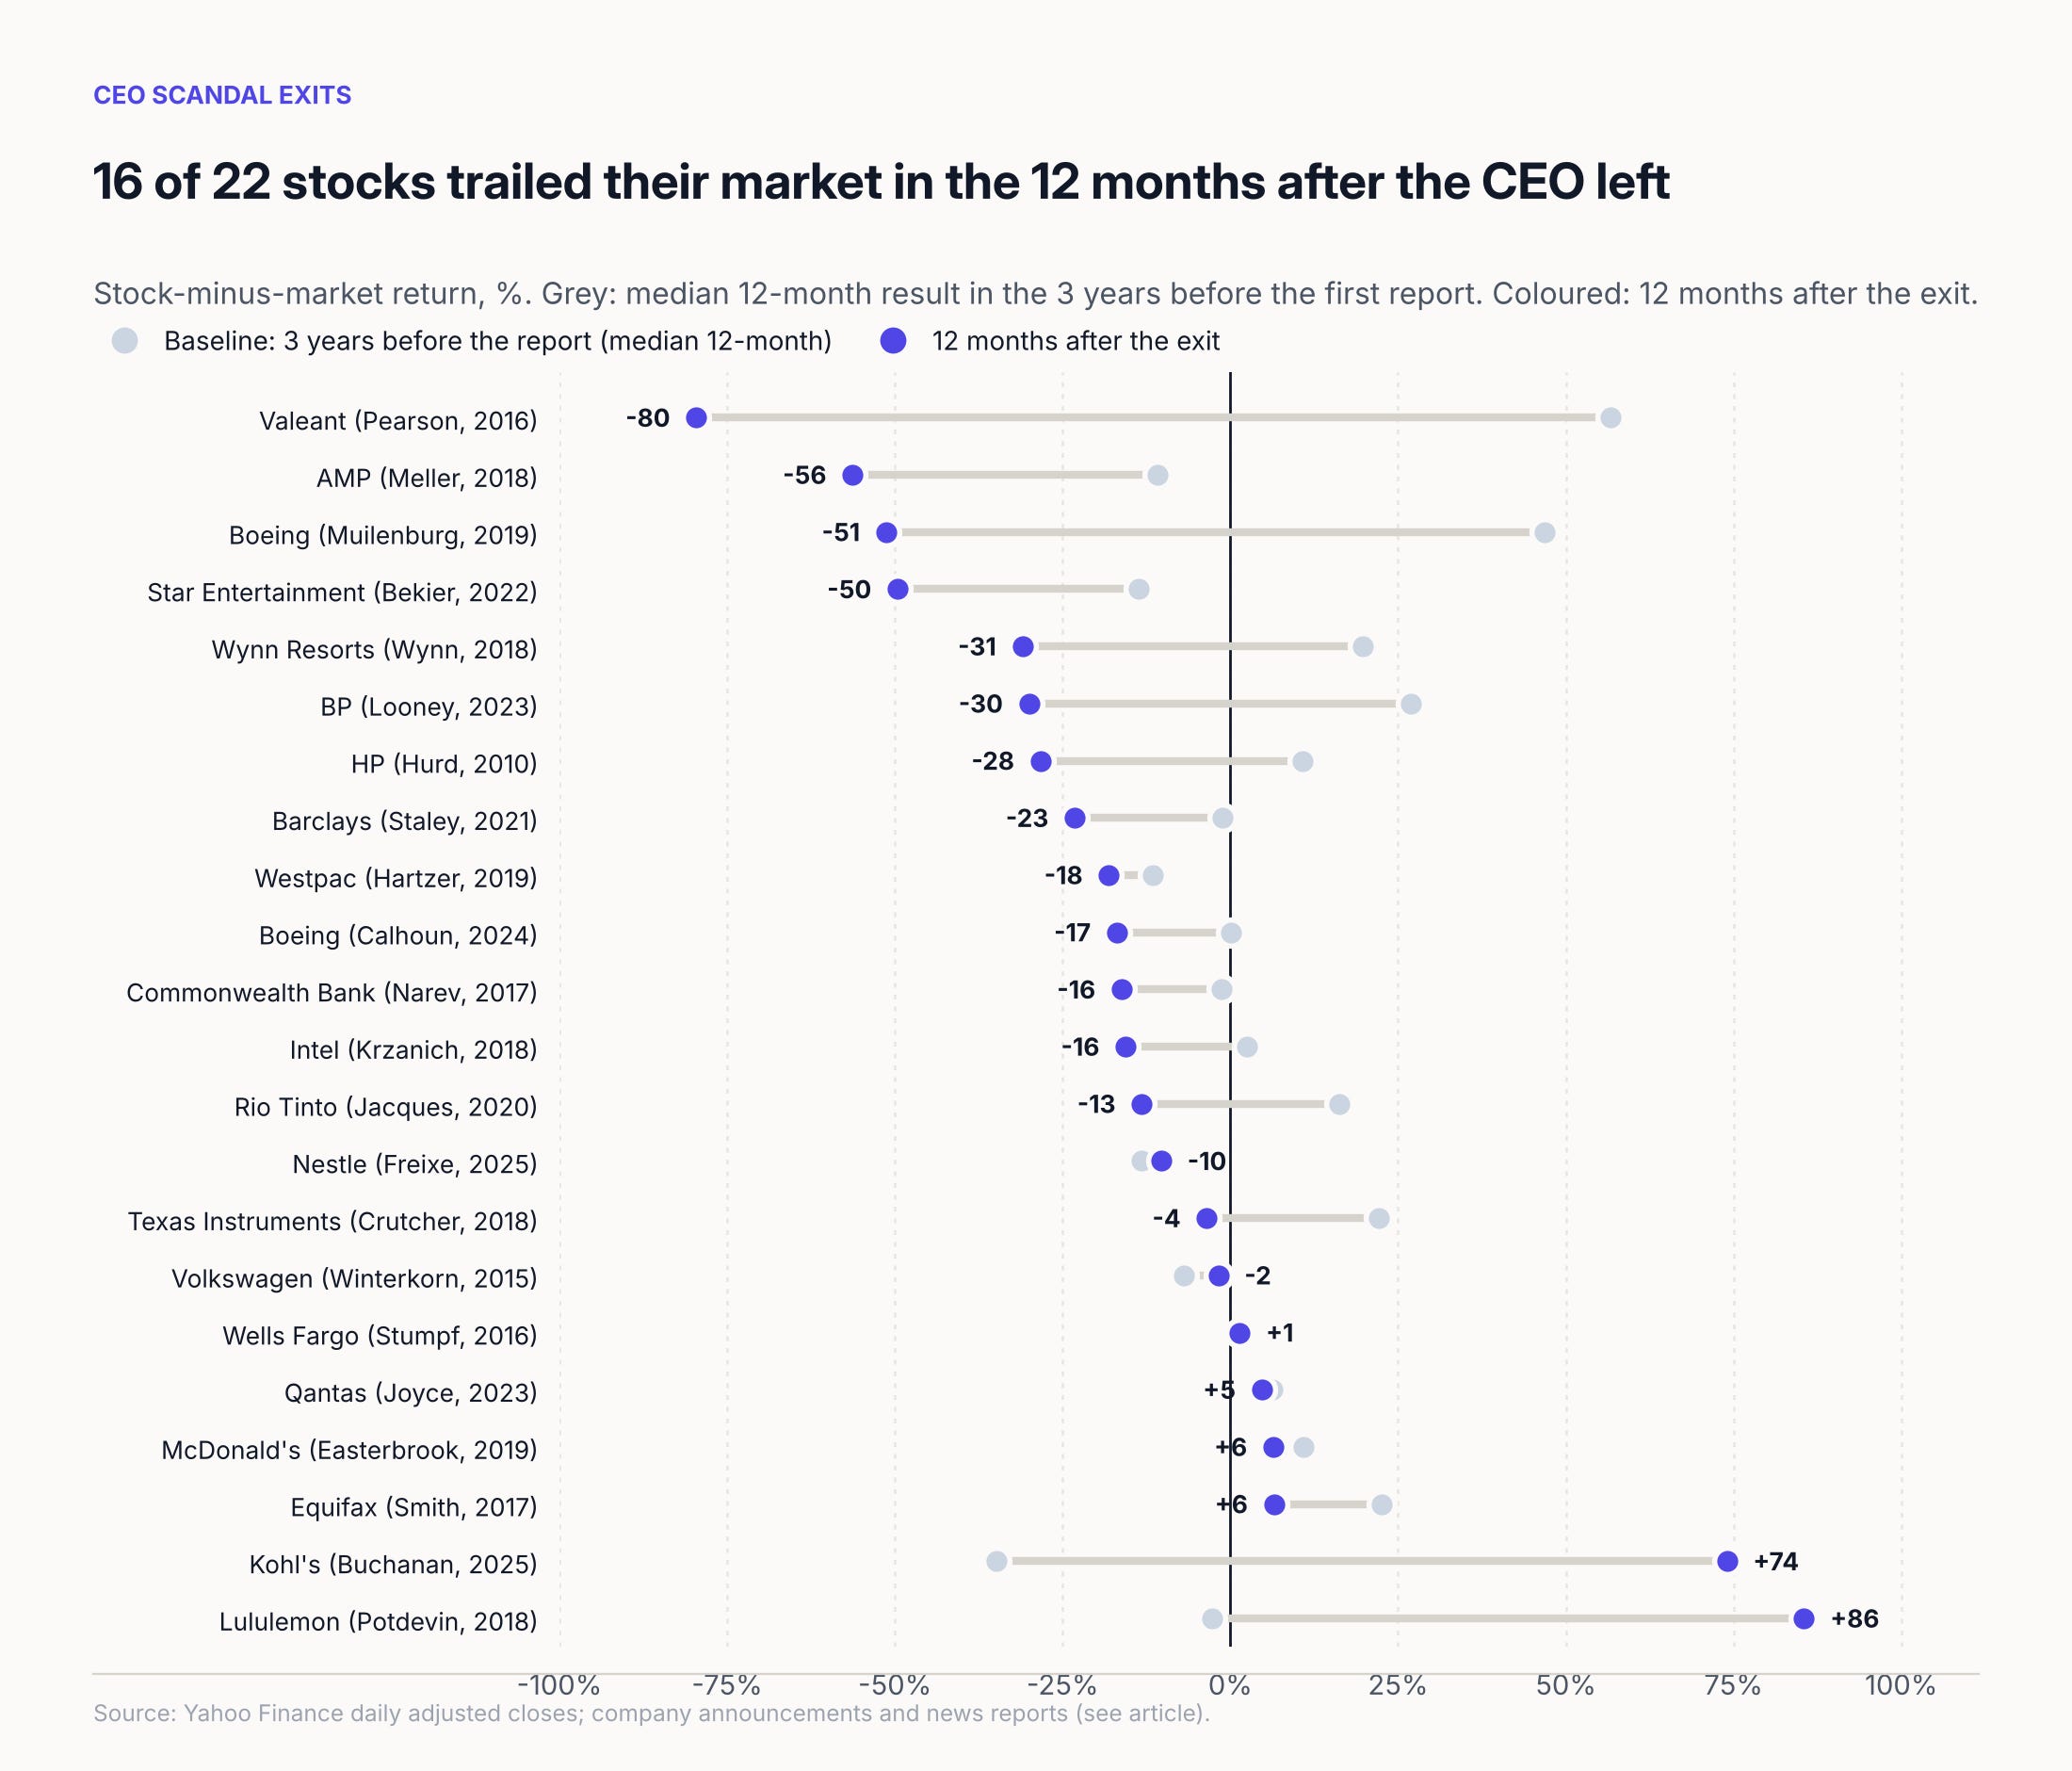
16 of 22 stocks trailed their market in the 12 months after the exit. To check whether these stocks were simply weak performers, each result is set against the stock’s own baseline. 17 of 22 did worse after the exit than their baseline, by a median of 17.6 percentage points. Eight stocks trailed their market by more than 20% and two beat it by more than 20%.
The two large gains were both personal conduct cases. Lululemon rose 85.5% more than the S&P 500 in the year after Laurent Potdevin left in 2018. Kohl’s rose 74.0% more than the S&P 500 in the year after Ashley Buchanan was fired in 2025; it had trailed by 80.4% in the year before. Excluding these two, the personal conduct median for the 12 months after is -19.4%. The largest loss was Valeant at -79.6%.
The raw 12-month stock return, before any market adjustment, had a median of -4.5%.
Result 5: exit-day moves were small
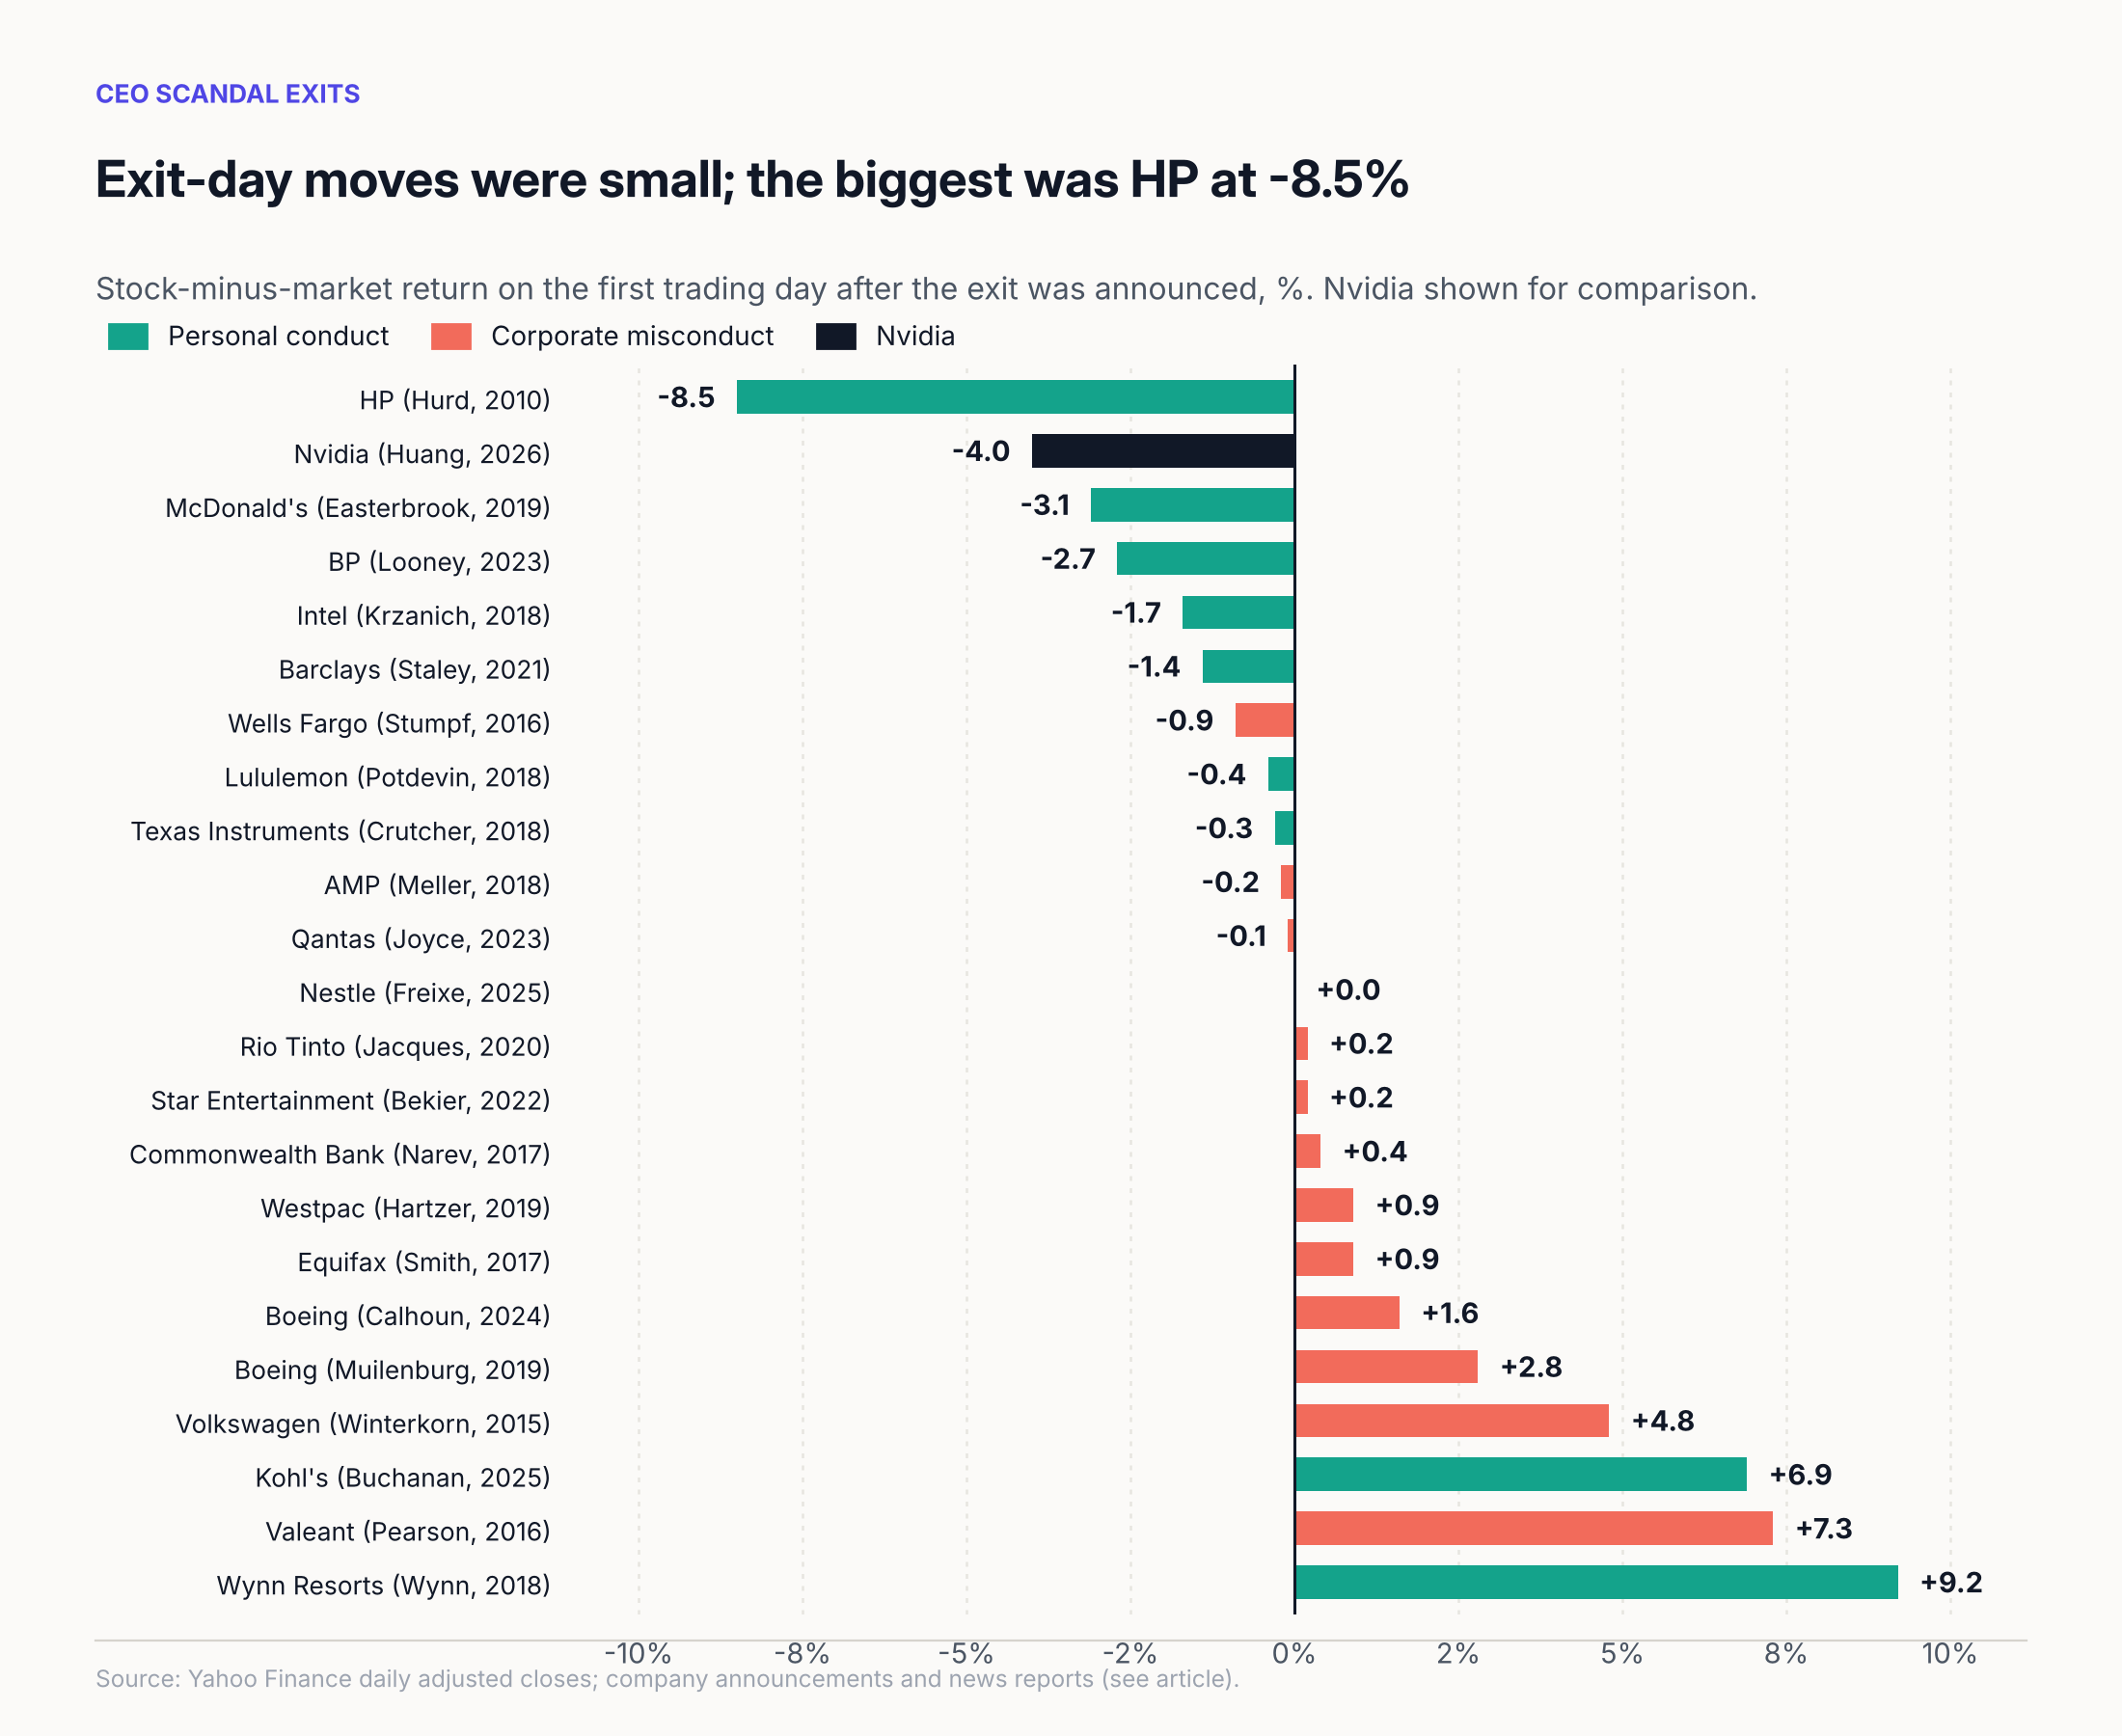
The median exit-day result was +0.1%. Only 4 of 22 moved more than 5% in either direction: HP (-8.5%), Kohl’s (+6.9%), Valeant (+7.3%) and Wynn Resorts (+9.2%). When the exit was announced together with the news that led to it, the median was -1.4%. When the exit came after a period of reports, the median was +0.9%, and 10 of those 13 stocks rose on the day the CEO’s departure was announced.
Nvidia’s -4.0% on its exit day is the second-largest fall in the set.
Where Nvidia sits
Nvidia is a personal conduct case by type, but its timing resembles the corporate cases: there were 10 trading days of reports before the exit, and the stock fell 17.7% relative to the S&P 500 over that period. That is larger than the median fall of 13.6% across the 13 earlier cases with a gap between report and exit.
In the earlier cases, the 12 months after the exit were negative relative to the market for the median stock in both groups, and for 16 of 22 individual stocks. The spread was wide: the middle half of 12-month results ran from -29.6% to +0.6%. Nvidia has one trading day of data after the exit, so its own post-exit result cannot be measured yet.
Factors in Nvidia’s case that the earlier sample does not cover: the company’s size, the reported national security dimension of the first relationship, an interim CEO who also remains CFO, and a sector that moved sharply in the same weeks.
Limitations
Sample size and selection. 22 cases, chosen by hand from well-documented exits. This is not a complete screen of all CEO departures linked to misconduct, and well-known cases may be ones with larger price effects.
Survivorship. All 22 companies still have price data on Yahoo Finance. Companies that were delisted or taken over after a scandal are missing; CBS was dropped for this reason.
Skew. Buy-and-hold differences are skewed by large single-stock moves. The mean 12-month result (-12.1%) differs from the median (-15.9%). Lululemon and Kohl’s more than account for the gap: without them the mean is -21.3%. The baseline comparison and the market model are included as checks.
Benchmarks. Each stock is compared with its home market, not its industry. Boeing, Volkswagen and the Australian banks moved with their sectors as well as with company news. The SMI is a price index without dividends, which raises Nestle’s measured result slightly. SOXX holds Nvidia.
Event dates. Dates are the first trading day that could react. For Barclays, the date is the day the regulators’ findings and the exit were announced together; the investigation into Jes Staley’s disclosures had been public since February 2020. For Nvidia, the sources date the first report to 29 October but do not give the time of day. If it was published after the close, the first reaction day is 30 October and there were 9 trading days between report and exit; Nvidia’s move on 29 October was small (-0.8%). Some scandals built up over weeks before a clear first report (Wynn, Valeant, Star Entertainment), and some exits were announced at a later date than the decision.
Overlapping events. The 12-month windows include later events such as Boeing’s continuing 737 MAX problems, COVID-19 in 2020 for several cases, and sector moves.
Daily data, no costs, no significance tests. Results use daily closes and exclude trading costs and taxes. With 22 cases and wide dispersion, no statistical significance tests are reported.
Nvidia. Only one trading day after the exit is in the data (to 13 November 2026).
Sources
TechCrunch, “The unfolding Jensen Huang scandal: a timeline”, 13 Nov 2026
Al Jazeera, “Why did Nvidia CEO Jensen Huang resign, and who is Colette Kress?”, 12 Nov 2026
CNBC, “Nvidia stock closes down over 4% after CEO Jensen Huang announces resignation”, 12 Nov 2026
Forbes, “Nvidia shares sink as rival chipmakers rise after Jensen Huang resigns”, 12 Nov 2026
Event dates: Wikipedia entries for Mark Hurd, Brian Krzanich, Steve Easterbrook, Steve Wynn, Lululemon Athletica, Bernard Looney, Jes Staley, the Wells Fargo cross-selling scandal, the Volkswagen emissions scandal, Bausch Health (Valeant), the 2017 Equifax data breach, Dennis Muilenburg, Dave Calhoun, the destruction of Juukan Gorge, Brian Hartzer, AMP Limited, Ian Narev and Alan Joyce; Texas Instruments press release, 17 Jul 2018; ABC News on Kohl’s, 1 May 2025; Al Jazeera on Nestle, 2 Sep 2025; AGB on The Star, 28 Mar 2022.