


Some commentators are known for calling a market crash before it happened. Most of them made other calls too, and a forecaster who predicts a crash every year will eventually be right. The question for an investor is whether acting on a call paid, once the time spent waiting for it is counted.
I tested twelve well-known calls, from Roger Babson in 1929 to Michael Burry in 2023. For each, I compared moving from the S&P 500 into cash at the time of the call with staying invested. I then ran the same test on every month since 1934 to measure how often a crash call is right by chance.
Summary
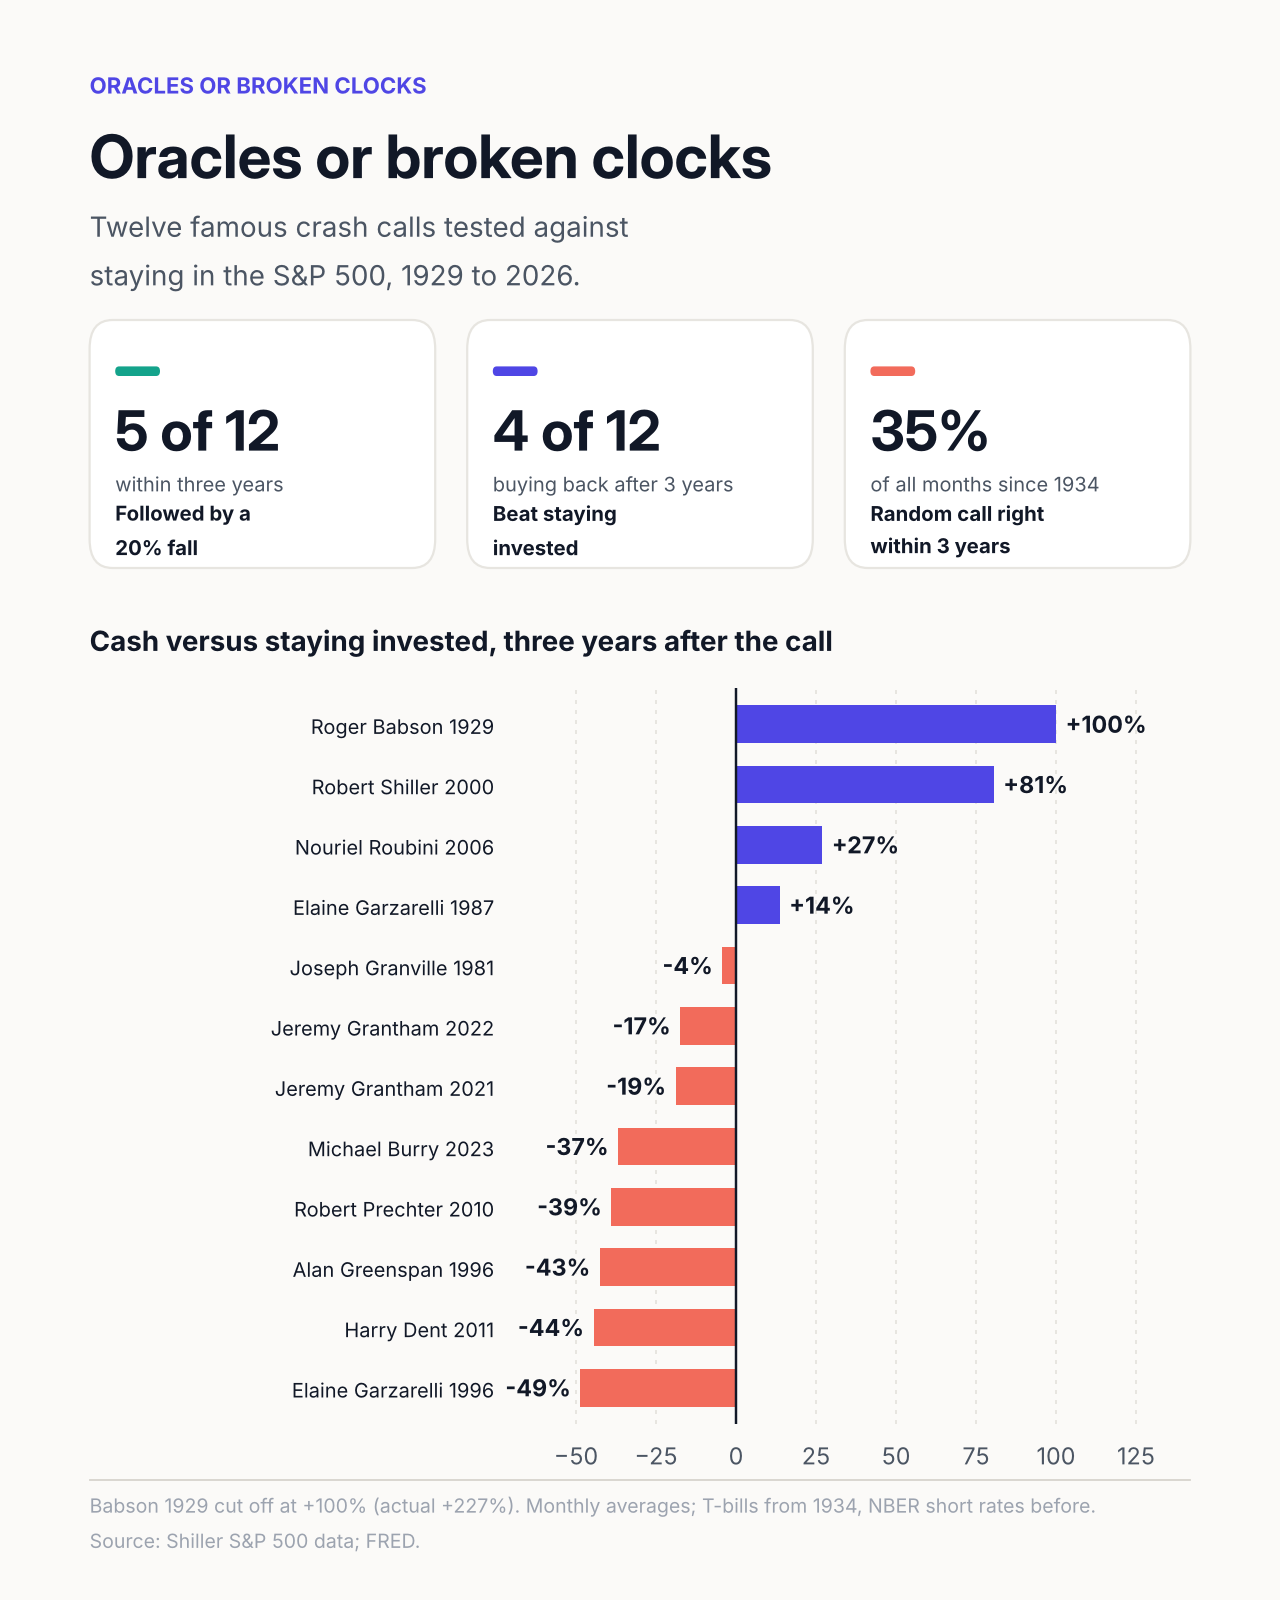
Five of the twelve calls were followed by a fall of 20% or more within three years. A crash call made in a random month since 1934 was followed by one within three years 35% of the time.
Moving to cash at the call and buying back three years later beat staying invested for four of the twelve calls: Babson (1929), Garzarelli (1987), Shiller (2000) and Roubini (2006).
With perfect hindsight on when to buy back, six of the twelve calls paid by more than 1% and two by 0.3% or less. For the other four, even buying back at the best month within three years left the investor behind.
The longer a call is allowed to take, the more often it is right and the less often a correct call pays. Within one year, 11% of random months were followed by a 20% fall and all of those paid with perfect re-entry. Within five years, 54% were followed by one and 68% of those paid.
An investor who stayed in cash from 1934 earned 3.5% a year, against 11.1% for the S&P 500 with dividends.
How to test a crash call
A call can be right and still lose money. If the market rises 30% before it falls 25%, the low is still above the level at the time of the call, and the investor who sold has paid for being early. The test needs to separate being right from being paid.
Fix the call. Use the date and words of the original call, from a dated source, not later summaries.
Define “right” in advance. Here, a fall of 20% or more in the S&P 500 price index from a peak at or after the call, reaching -20% within three years of the call.
Measure the cost of waiting. This is the rise from the call to the market peak, plus dividends given up, less interest earned on cash.
Check the breakeven. Acting on a call pays only if the low is below the level at the time of the call, after dividends and interest.
Test the best case and a practical case. The best case sells at the call and buys back at the exact low (hindsight, an upper bound). The practical cases buy back one, three or five years after the call.
Compare with a broken clock. Run the same tests on every month in the sample. A call is informative only if it is right more often than a call made at random.
The calls
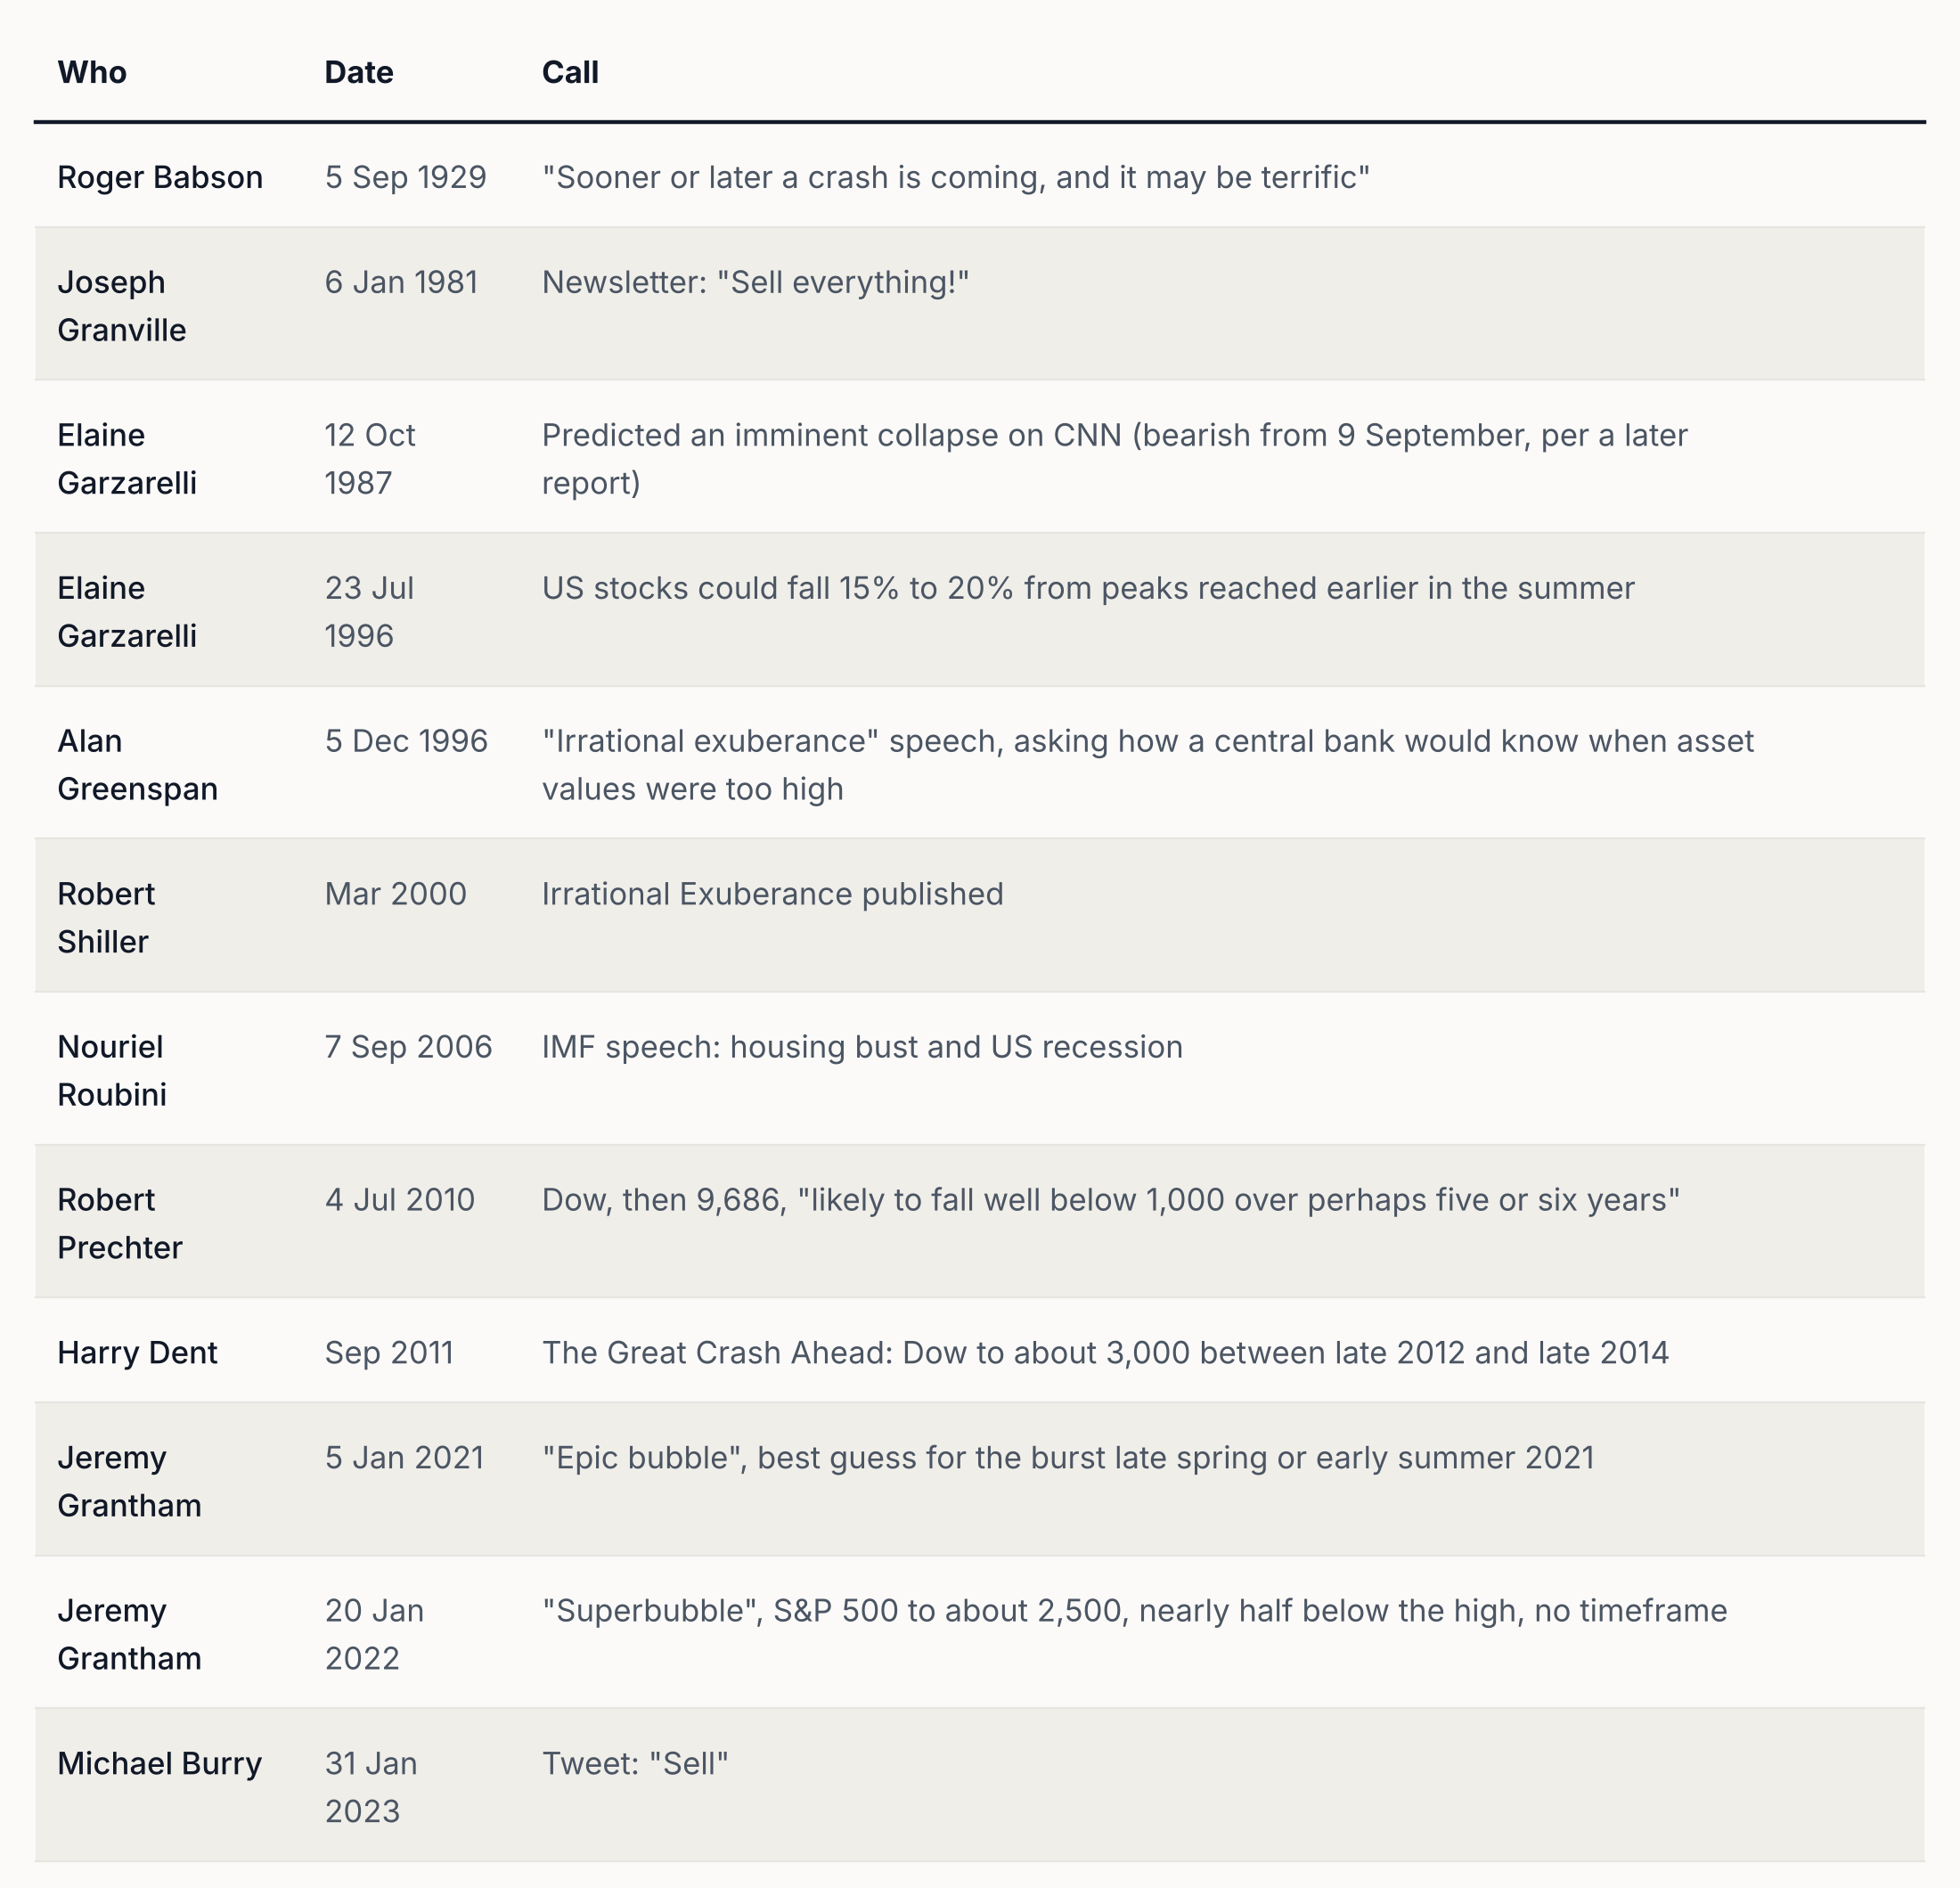
The list is not a random sample. Most of these people are known because at least one call came true. Babson gave the same warning at the same conference in 1927 and 1928; in 1929 he said he was repeating what he had said in the two previous years. Greenspan was Federal Reserve chair, not a commentator, and his remark was a question, not a forecast; it is included because it is widely cited as a warning. Garzarelli’s 1996 warning referred to falls from earlier peaks, but this test only counts falls from peaks at or after the call. Burry said on 30 March 2023 that he had been “wrong to say sell”.
Result 1: what happened after each call
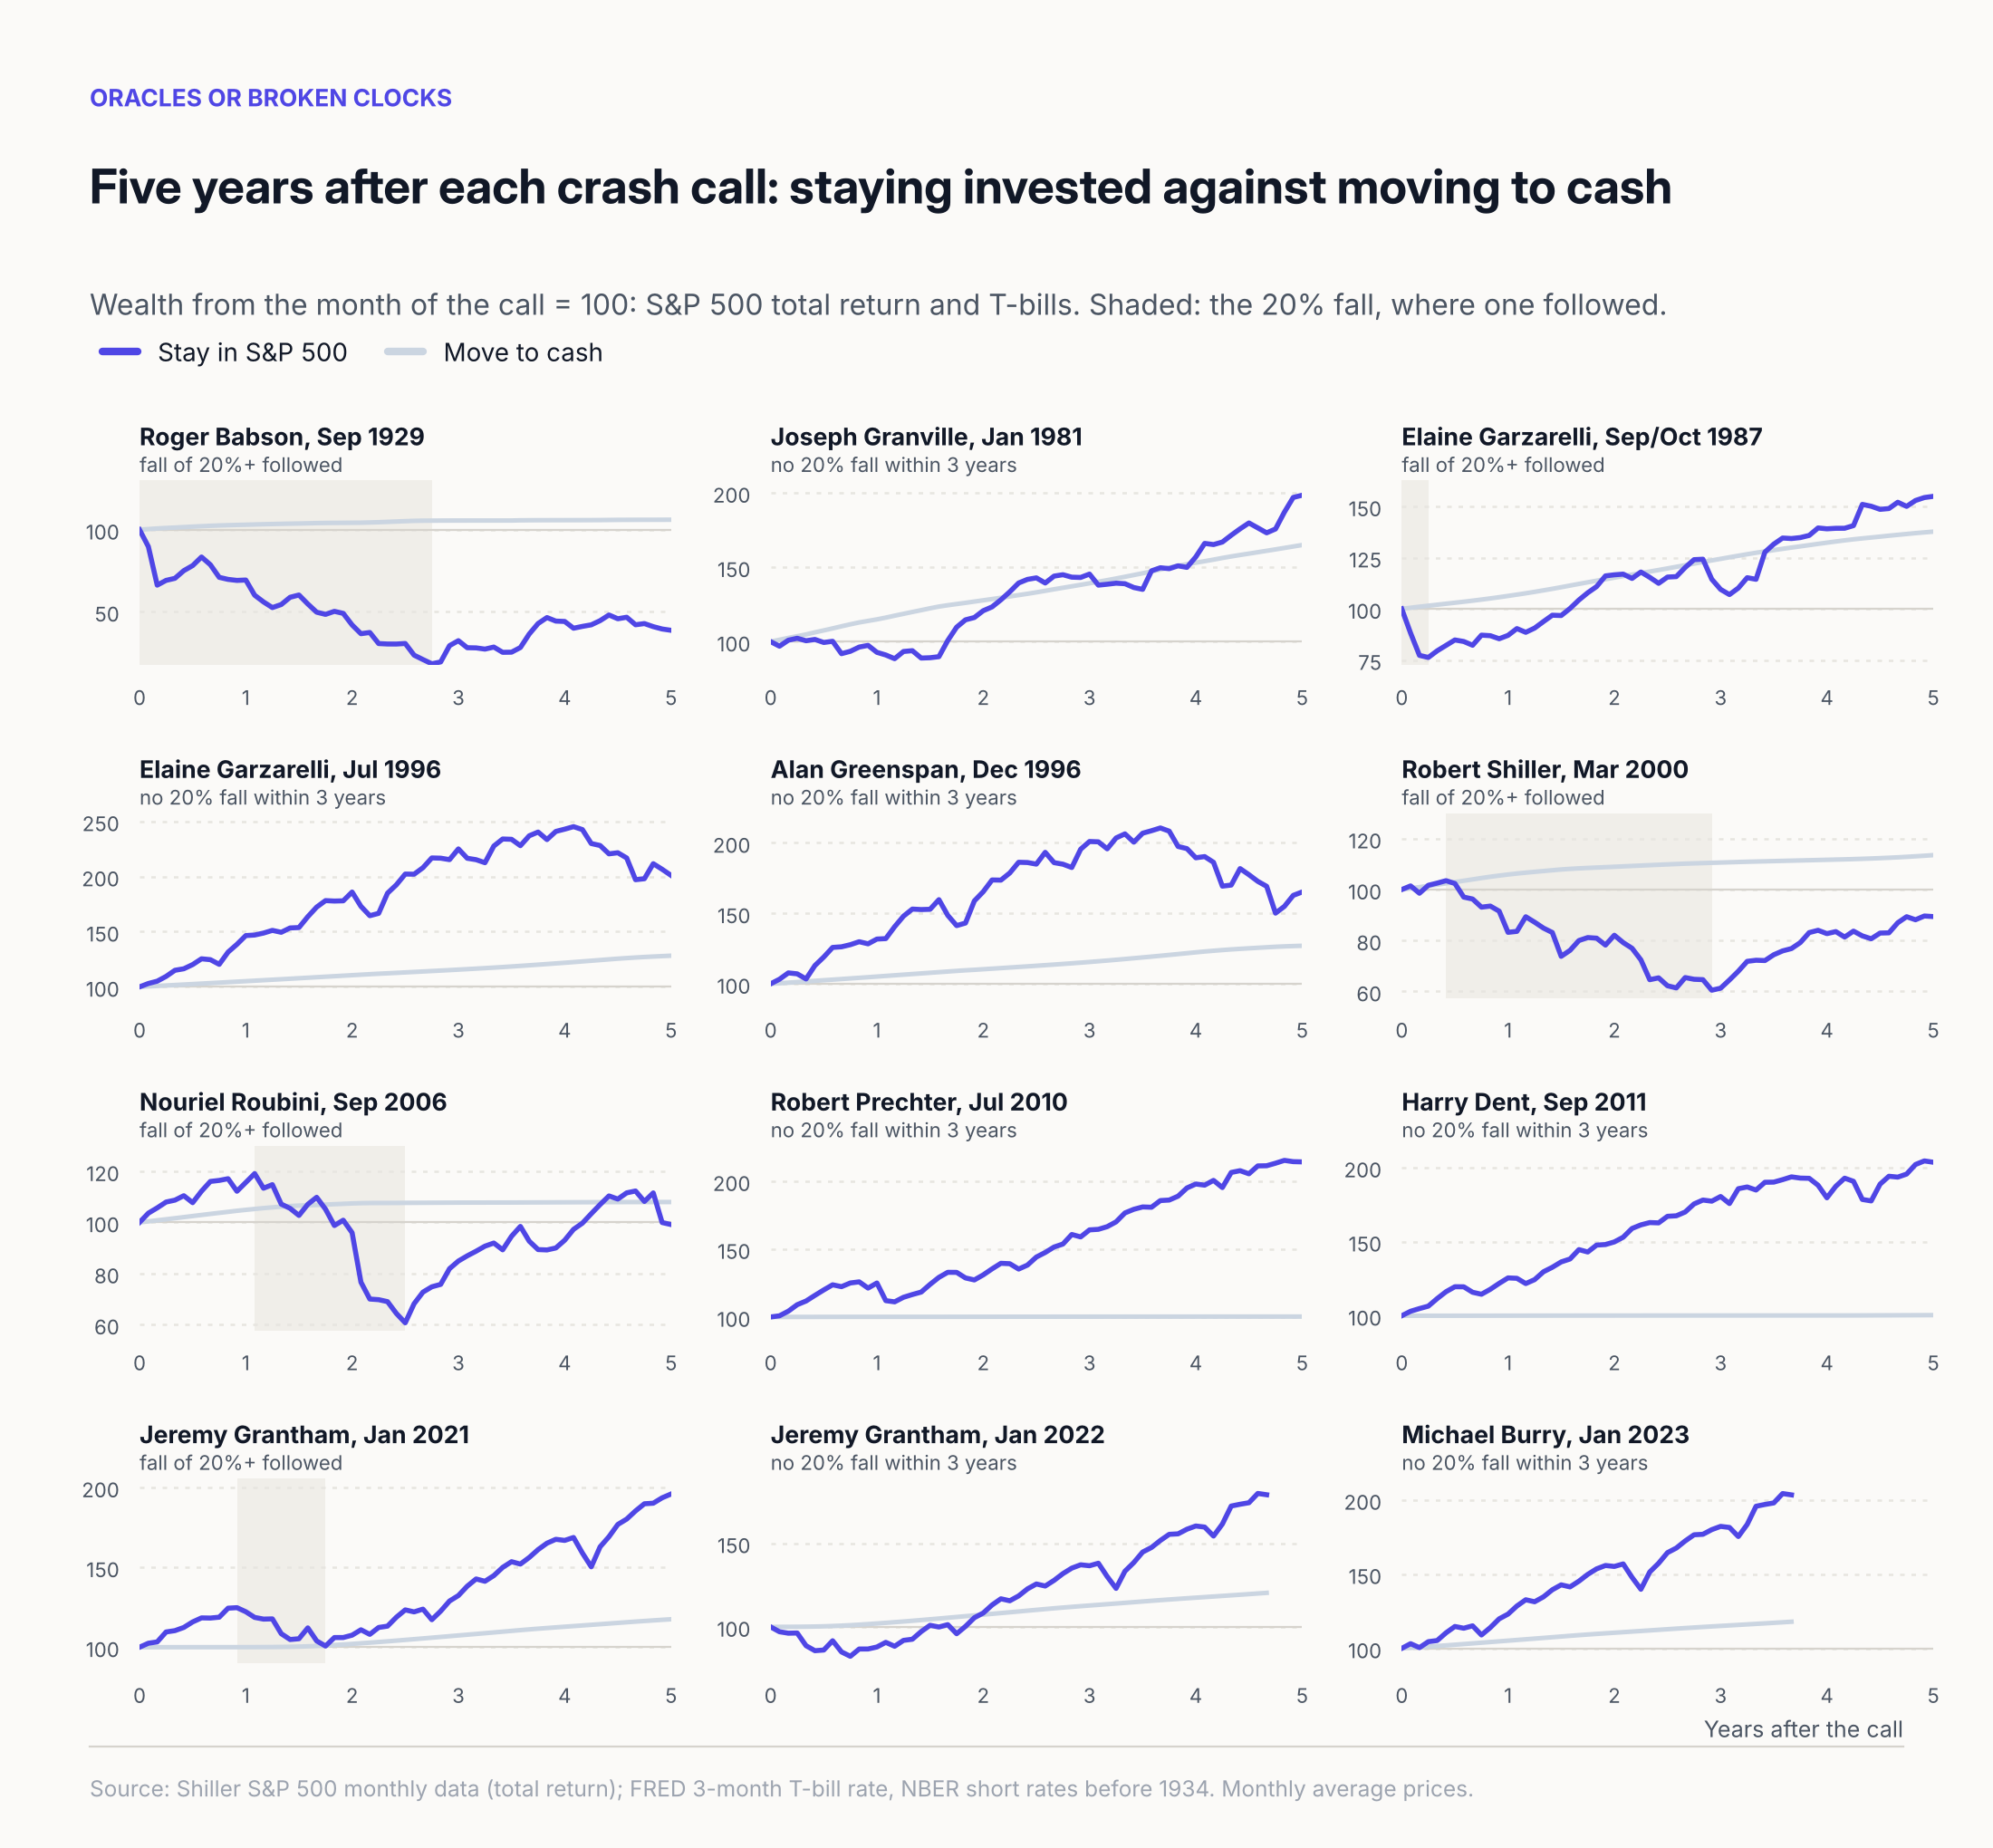
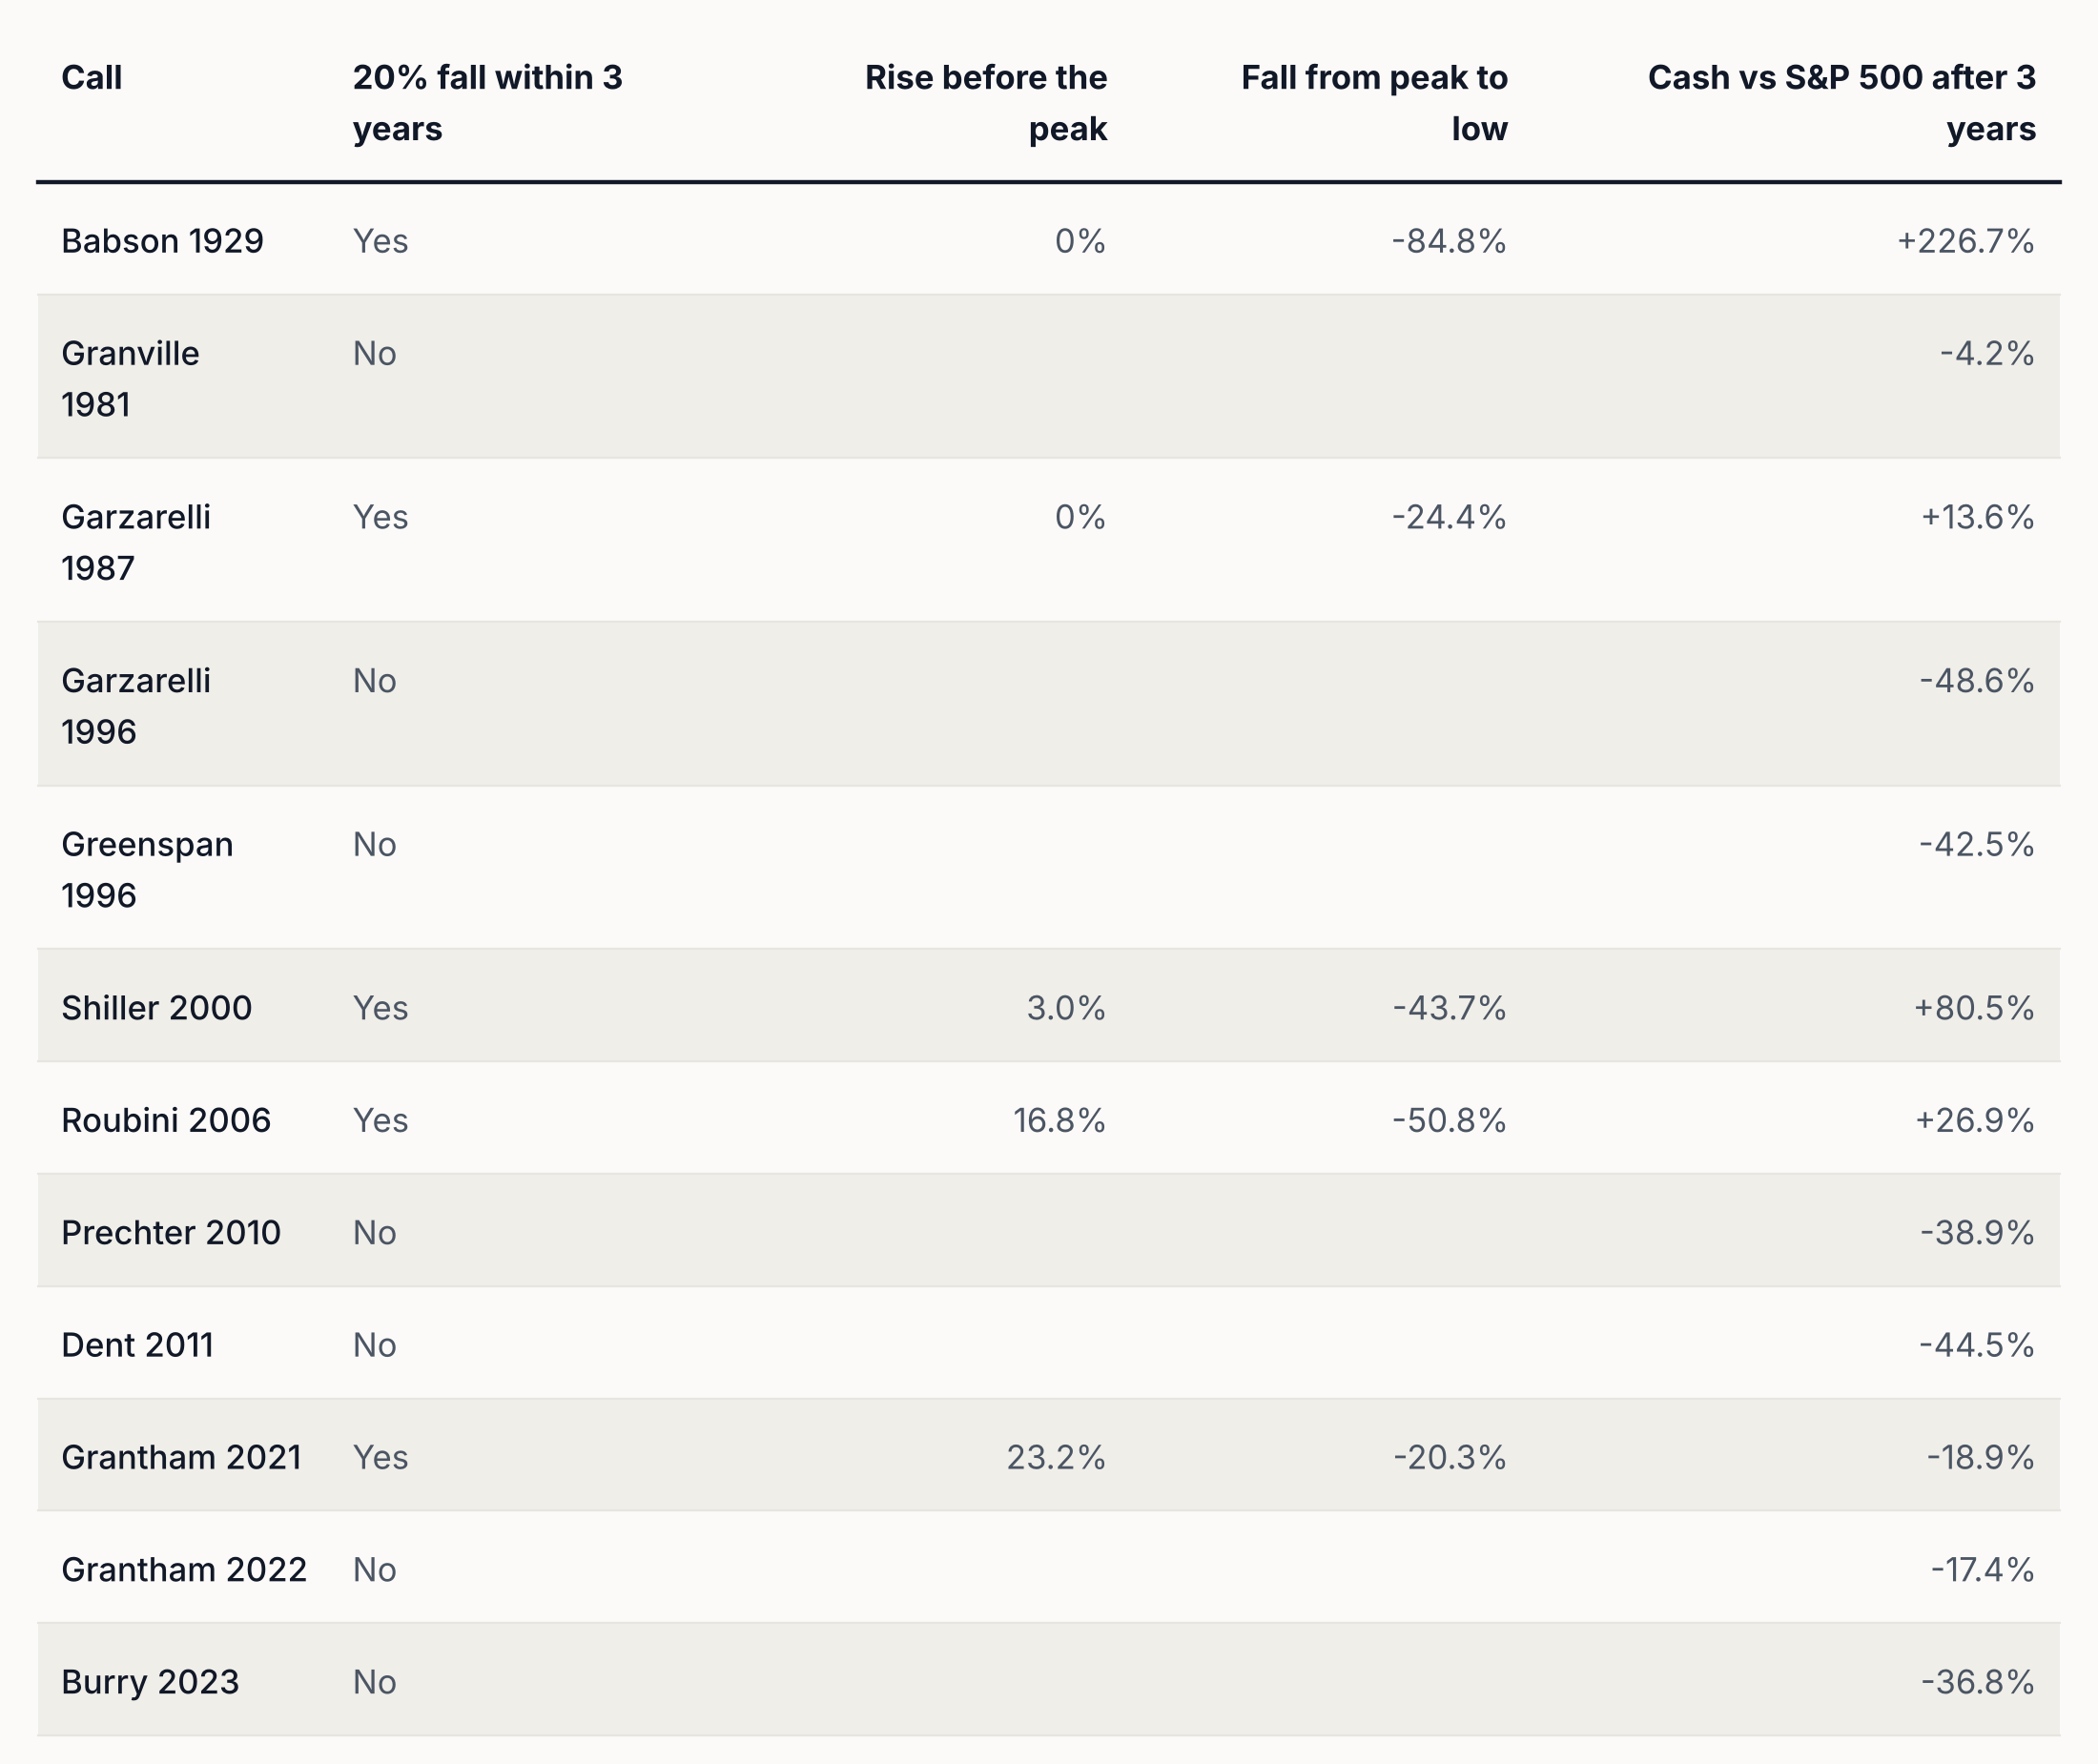
In the four calls that paid after three years, the market fell soon after the call and from close to the call-date level. Babson’s call came in the peak month on monthly averages. Garzarelli’s September 1987 start came a month after the August peak (monthly averages of 318.7 against 329.4). Shiller’s book came out in March 2000, five months before the S&P 500 peak on monthly averages, which was 3.0% higher; on daily closes the peak was 24 March 2000.
Roubini’s call was right and still cost money for a year. The S&P 500 rose 16.8% over the 13 months to the October 2007 peak, and cash was 9.3% behind after one year. The fall that followed was large enough (50.8%) to leave cash 26.9% ahead after three years.
Grantham’s January 2021 warning was followed by a fall of 20.3% in 2022, which counts as right on this test. His best guess for the timing was late spring or early summer 2021; the monthly peak came in December 2021, after the market had risen 23.2%. The October 2022 low was only 1.8% below the January 2021 level. Selling at the call and buying back at the exact low would have left an investor 0.3% ahead. Three years after the call, cash was 18.9% behind.
Granville’s call is the reverse case. There was no 20% fall after January 1981 on monthly average prices: the largest fall below the call-date level was 17.7%, and the largest from a later peak was 18.6% (April 1981 to July 1982). But T-bills yielded about 15% at the time, and cash was 23.9% ahead after one year. By three years the S&P 500 had recovered and was 4.2% ahead.
Result 2: the best case and the practical case
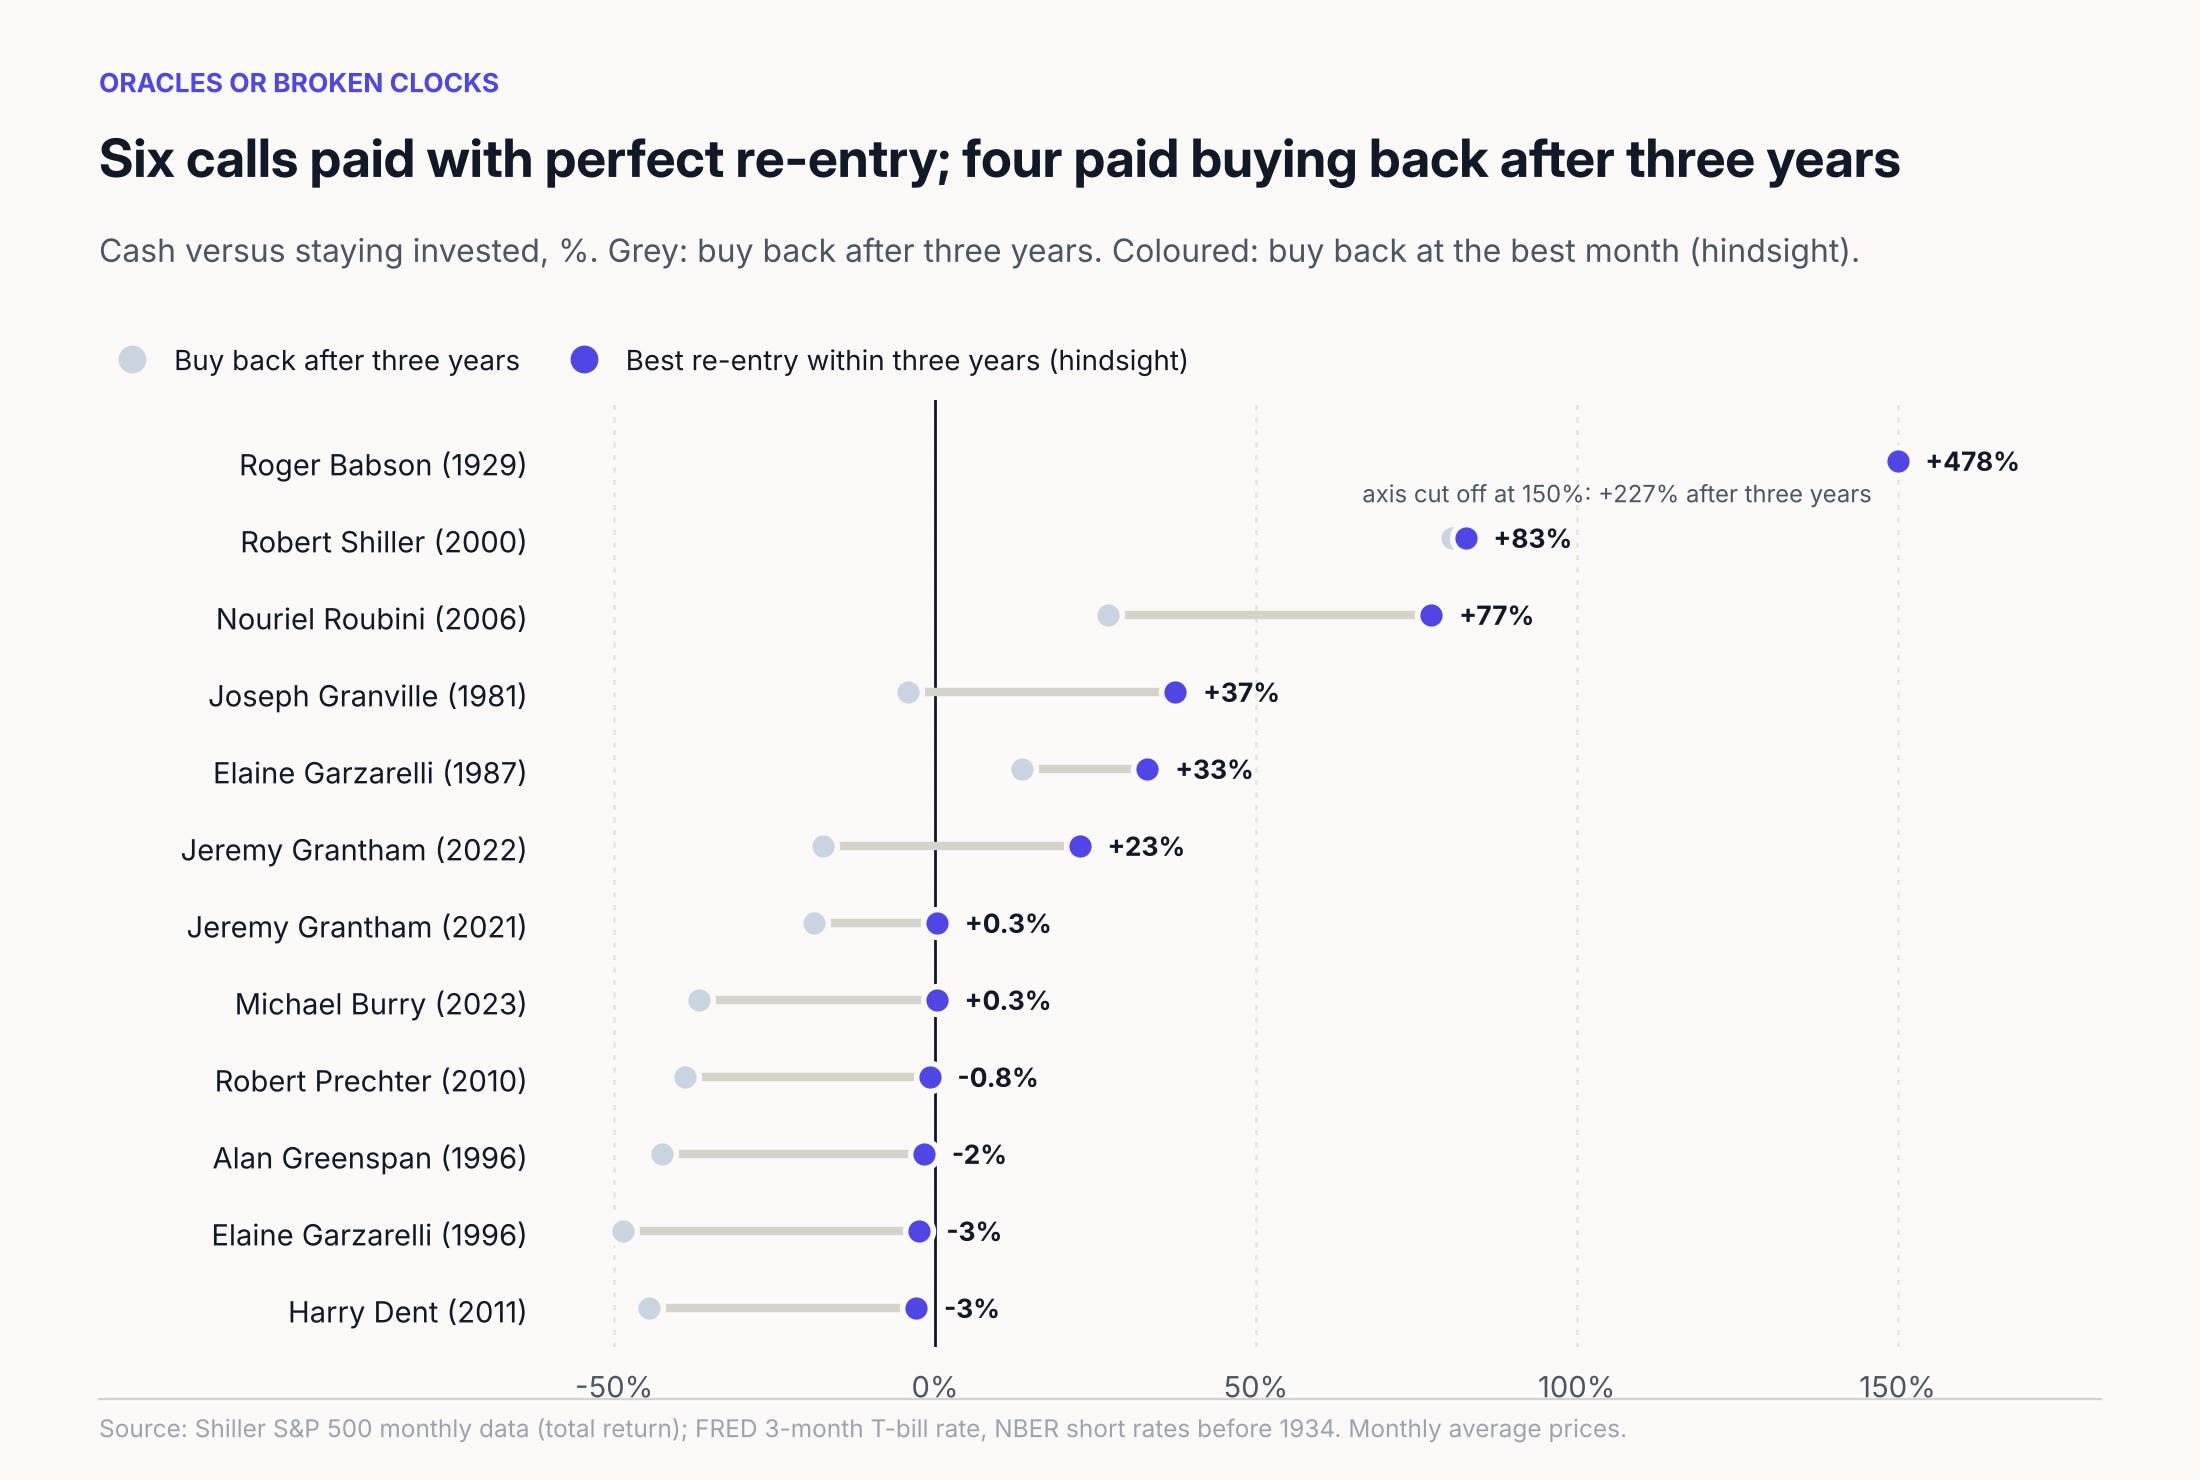
Best case (hindsight): selling at the call and buying back at the best month within three years beat staying invested by more than 1% for six of the twelve calls. For Grantham 2021 and Burry the best month left cash 0.3% ahead. For Greenspan, Garzarelli 1996, Prechter and Dent, the best month to buy back was within four months of the call, and even then cash was 0.8% to 2.9% behind.
Practical case: buying back three years after the call beat staying invested for four of the twelve. After five years it was three of ten (the two most recent calls do not have five years of data).
Result 3: the breakeven
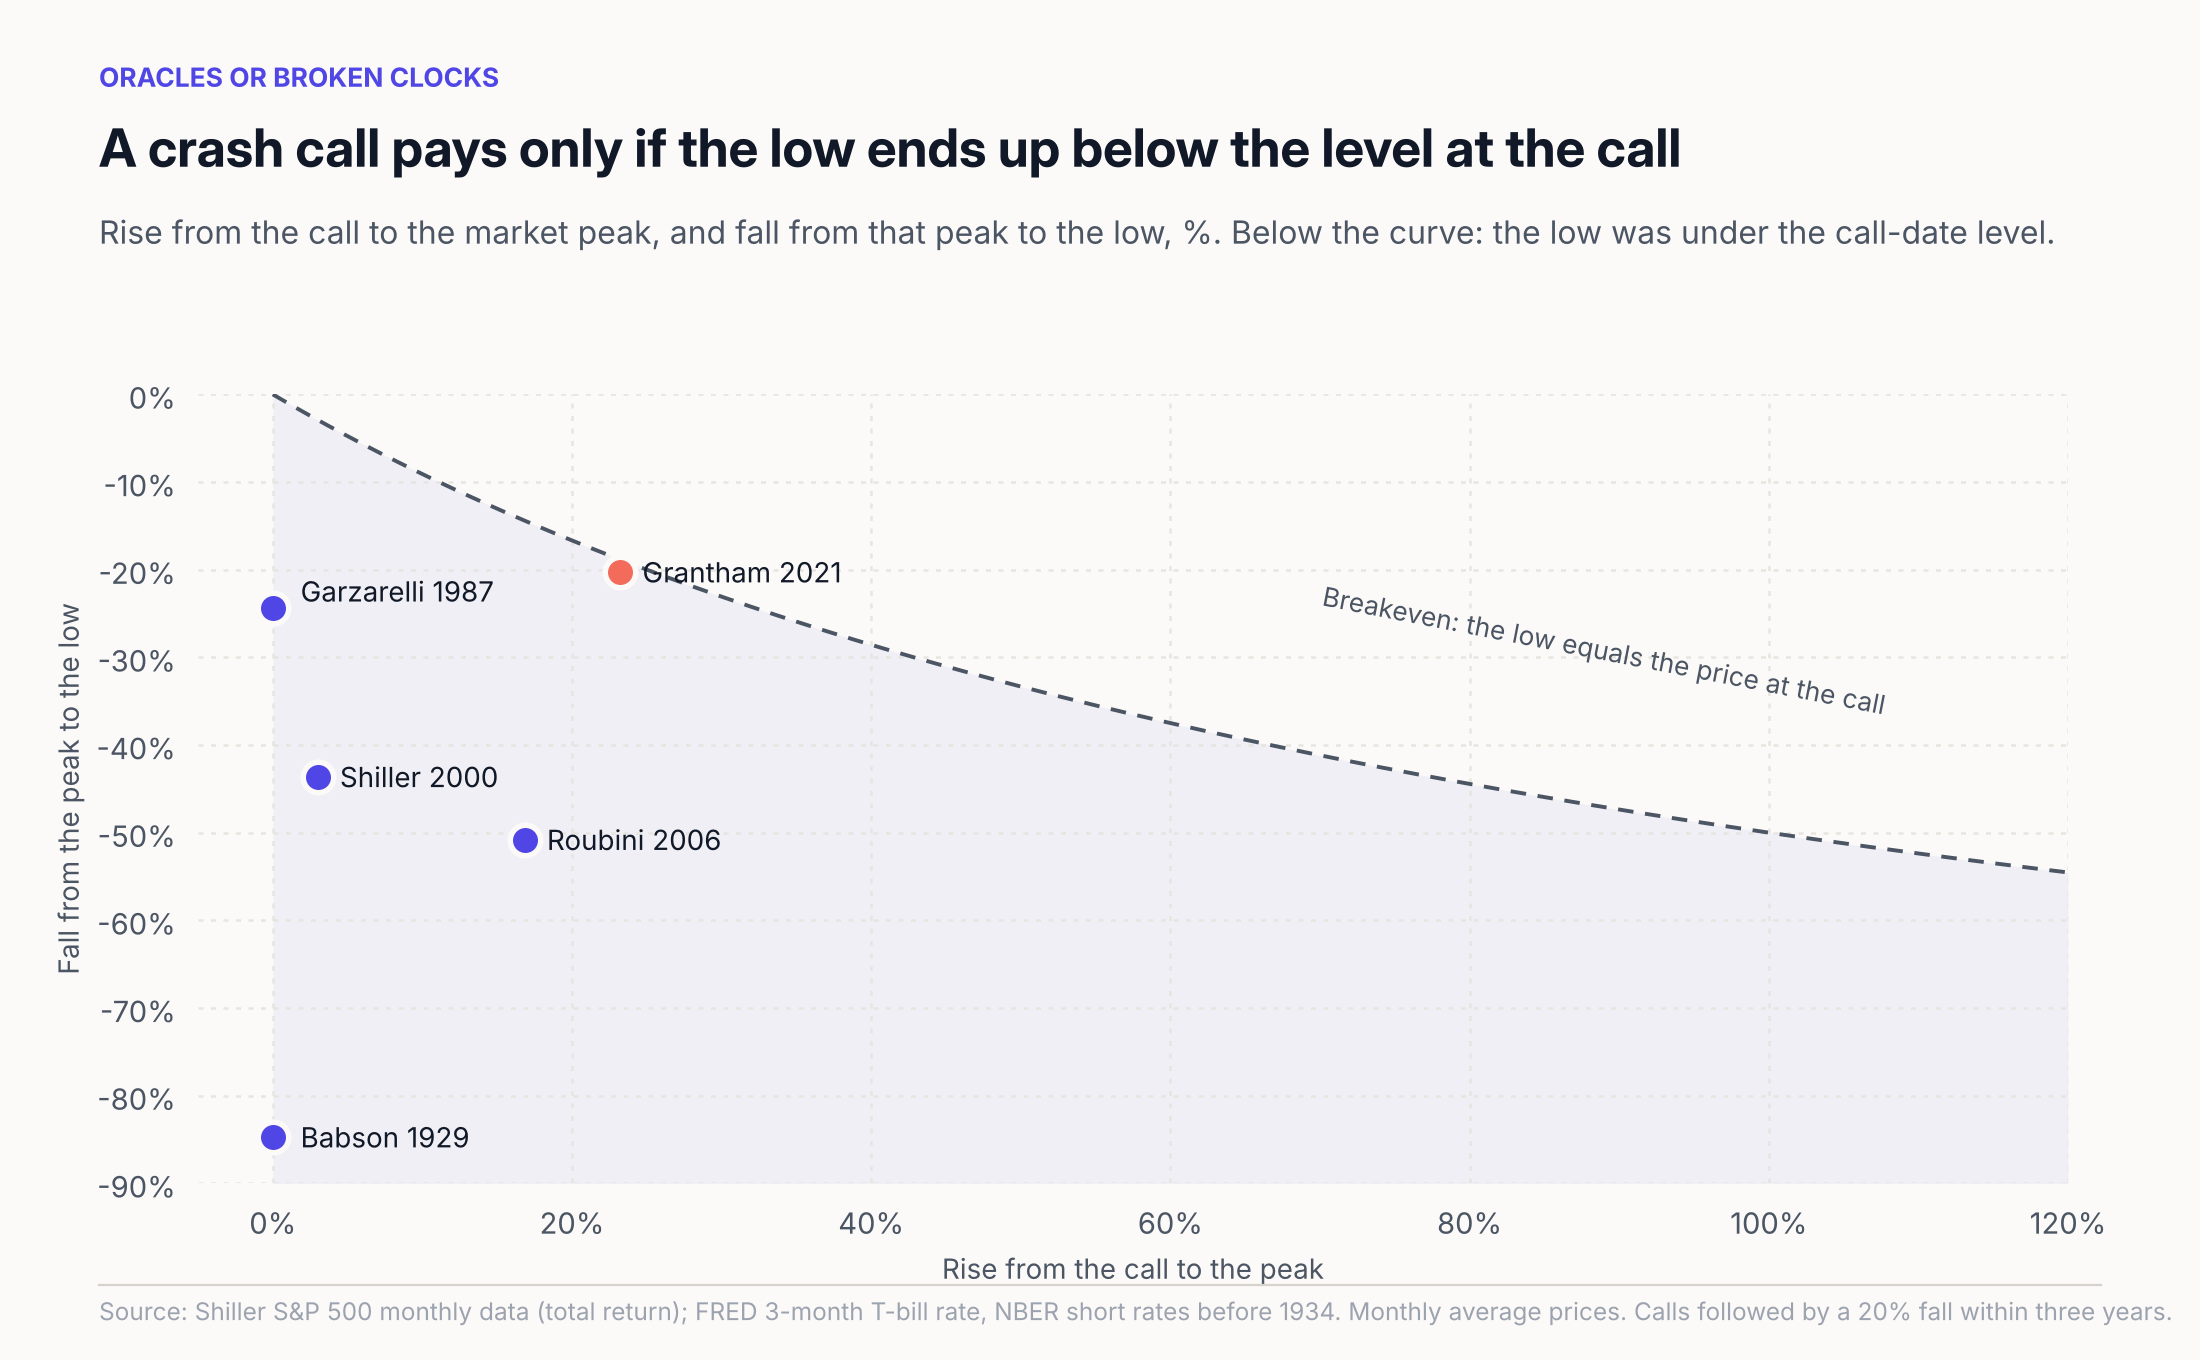
For a call to pay, the fall from the peak must be larger than the rise to the peak. A 20% rise needs a fall of about 17% just to get back to the call-date level, before counting dividends. A 50% rise needs a fall of a third. The chart plots the five calls that were followed by a 20% fall; the dashed line is the breakeven. Grantham 2021 sits on it.
This is the cost of being early. It grows with every month of rising prices between the call and the peak.
Result 4: how often a broken clock is right
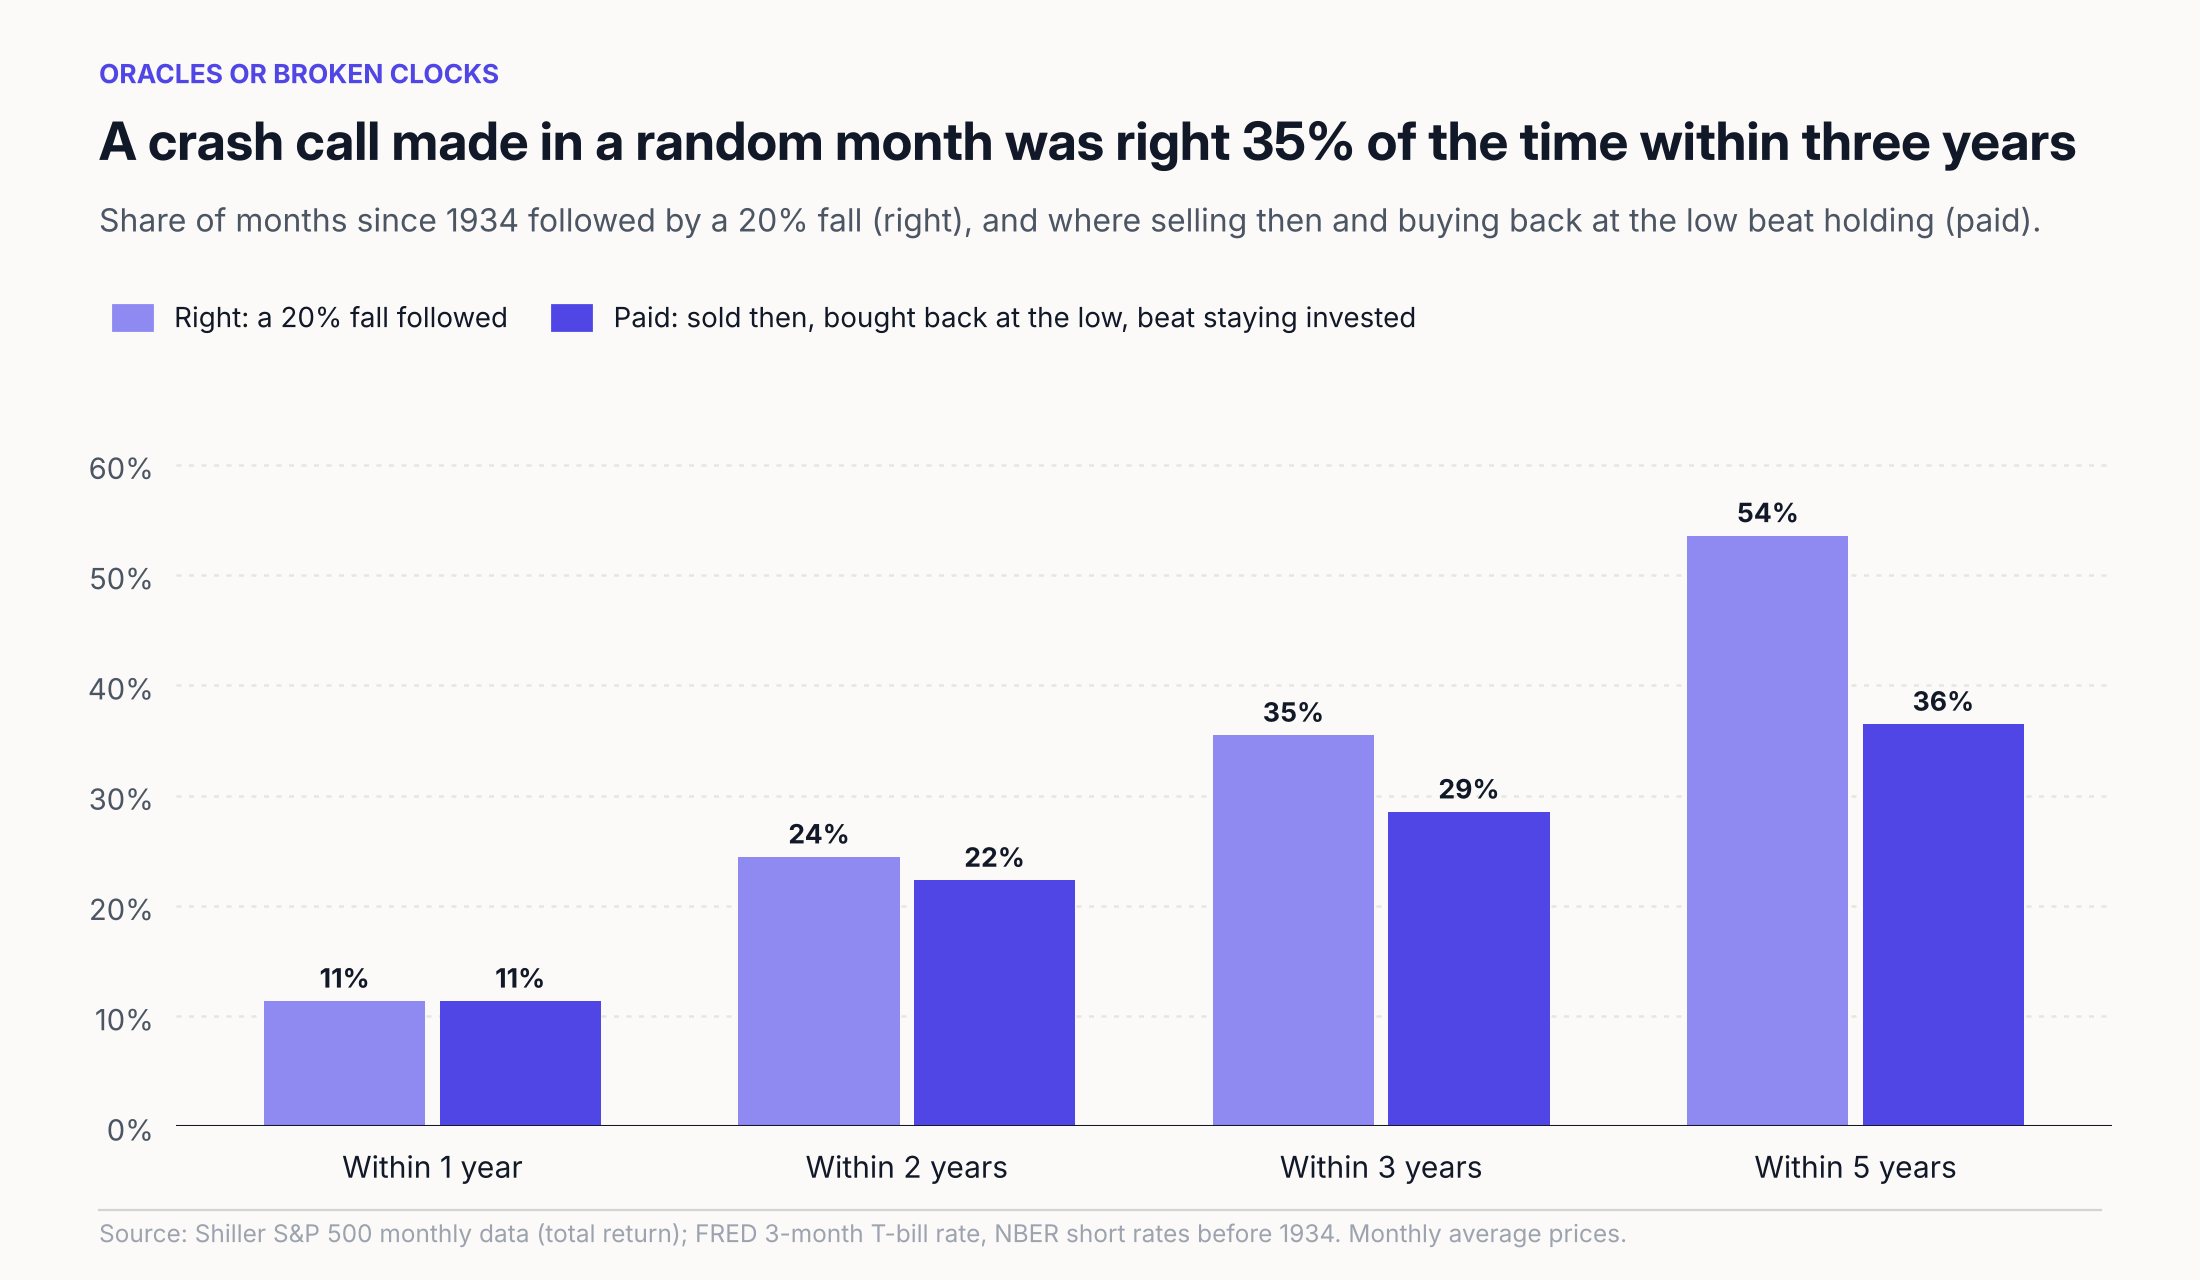
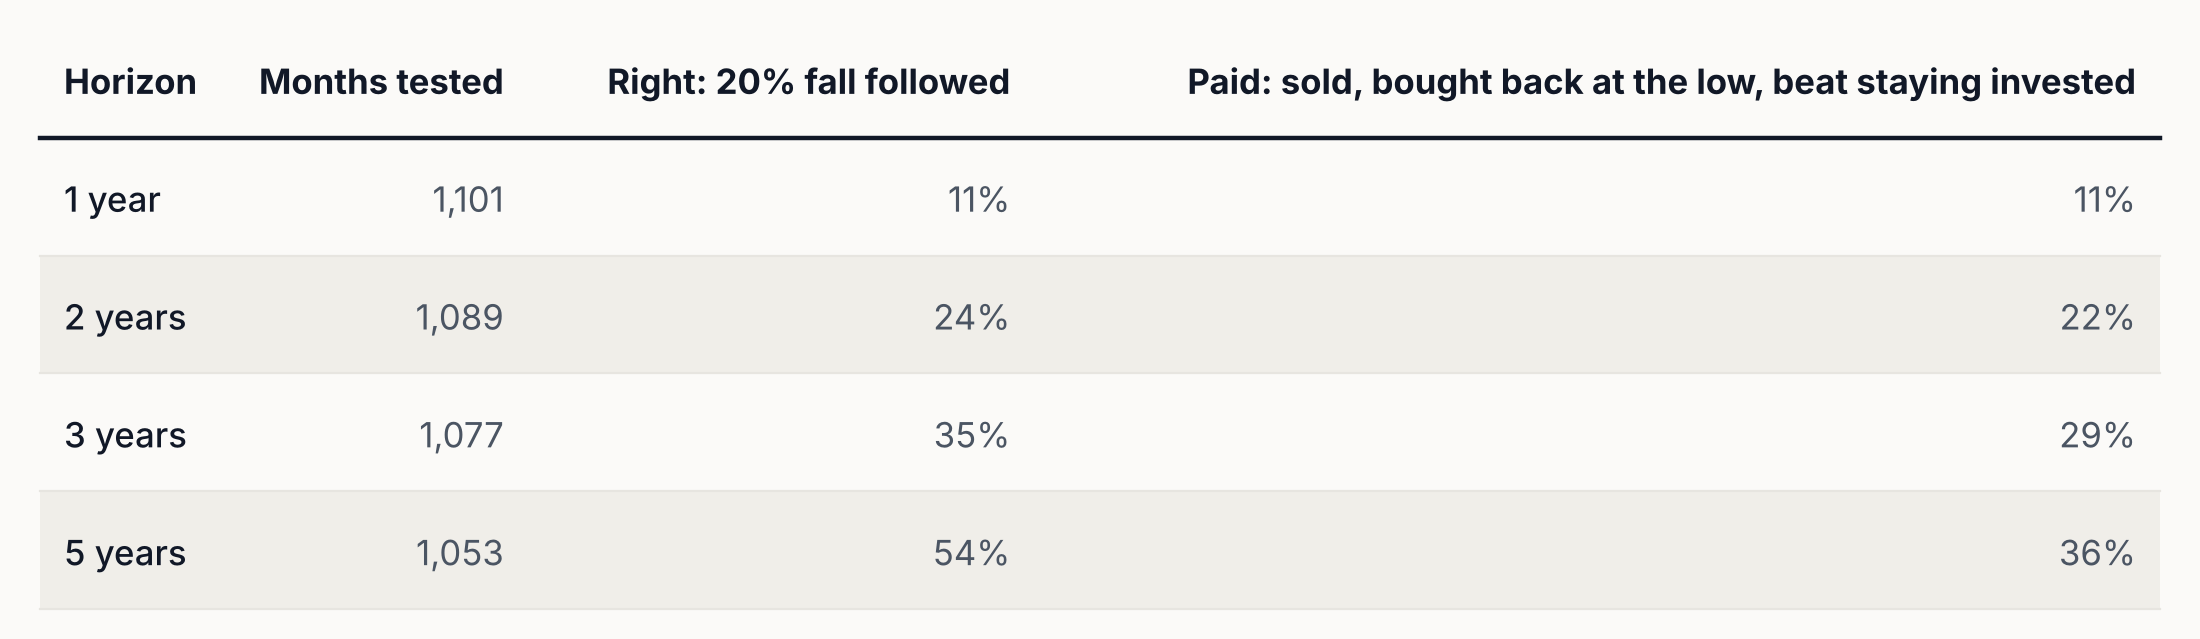
A forecaster who called a crash every month since 1934 would have been right within five years more than half the time. The share that paid, even with perfect re-entry at the low, rises much more slowly. Of the months followed by a 20% fall within five years, 68% paid; the rest were followed by a fall that started from a higher level than the call.
Five of the twelve famous calls (42%) were followed by a 20% fall within three years, against 35% for a random month. Twelve calls is too few to separate these numbers, and the sample was chosen partly because some of the calls came true.
Staying in cash cost more. From January 1934 to September 2026, cash returned 3.5% a year and the S&P 500 with dividends 11.1%. From July 2010, the month of Prechter’s call, cash returned 1.5% a year and the S&P 500 14.9%.
Questions to ask about a crash call
What exactly was said, and when? Is the source dated at the time of the call?
What would count as being wrong, and by when?
How many other crash calls has the same person made, and how did those turn out?
How far would the market have to fall from today’s level, after dividends and interest on cash, for acting on the call to pay?
When would you buy back, and how would you decide?
Limitations
Monthly average prices. The Shiller data uses monthly averages of daily closes, so falls look smaller than on daily data. The 2022 fall was about 25% on daily closes and 18.5% on monthly averages from January 2022, so Grantham’s January 2022 call does not count as right on this test. The 2020 fall was 34% on daily closes and 19.1% on monthly averages. The base rates are therefore lower than they would be on daily data.
Start month. Each call starts in the month it was made. Garzarelli’s 1987 call starts in September, when she is reported to have turned bearish, because the October monthly average already includes the crash. That date comes from a Wall Street Journal report of 28 October 1987, written after the crash. Starting in October, the month of her public call, the largest fall on monthly averages is 14.0%, so the call does not count as right; cash is 2.6% ahead after three years and 16.7% ahead at the best re-entry. Four of the twelve calls would then count as right.
Cash before 1934. T-bill data starts in January 1934. For Babson, cash earns the NBER yield on short-term US government securities, which fell from 4.6% in September 1929 to under 0.1% in September 1932.
Dividends after June 2023. The Shiller data used here has no dividends after June 2023; they are filled at a 1.3% yield.
Base rate re-entry. In the base rate, “paid” uses the low of the 20% fall, which can come after the one- or two-year window.
What counts as acting. Every call is treated as a move of the whole portfolio into cash. Some callers recommended less: Babson advised paying down loans and avoiding margin, not necessarily selling everything. No transaction costs or taxes.
Selection. The calls are well known, which biases the list towards calls that came true. Their authors’ other calls are not all included.
Sources
Benzinga, “This day in market history: Granville warns investors to sell everything”
Wikipedia, “Elaine Garzarelli” (citing the Wall Street Journal, 28 Oct 1987)
Stephen Kirchner, “Did Nouriel Roubini predict the 2008 crisis?”
History News Network, “Eighty years ago today” (Babson, 1929)
New York Times via RealClearMarkets, “A market forecast warning: take cover”, 5 Jul 2010
Publishers Weekly, review of The Great Crash Ahead, Sep 2011
ThinkAdvisor, “GMO’s Grantham warns of epic bubble”, 5 Jan 2021
Benzinga, “Superbubble: legendary market pundit says stocks could fall by nearly 50%”, Jan 2022
Yahoo Finance, “Big Short Michael Burry admits he was wrong to say sell”, Mar 2023
Shiller S&P 500 monthly data, via the datasets/s-and-p-500 repository
Not financial advice